Solar flares
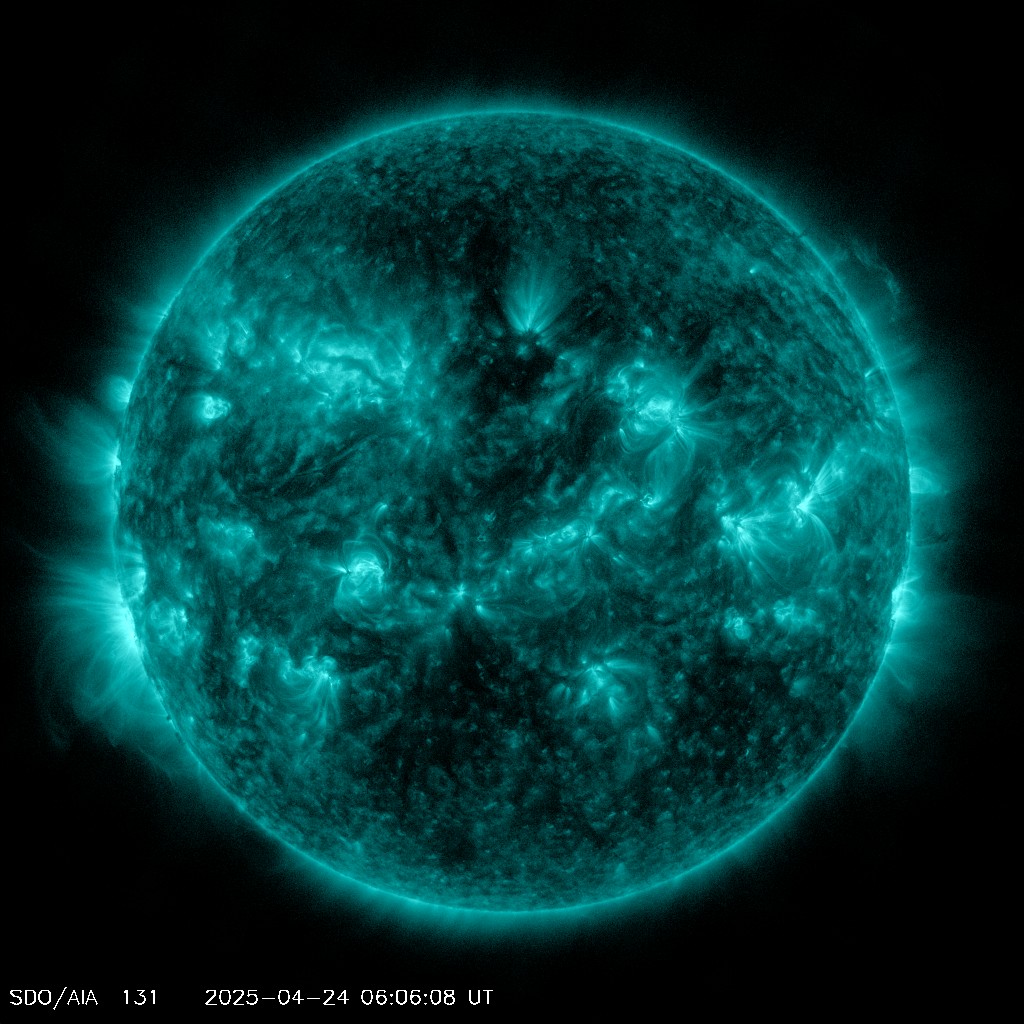
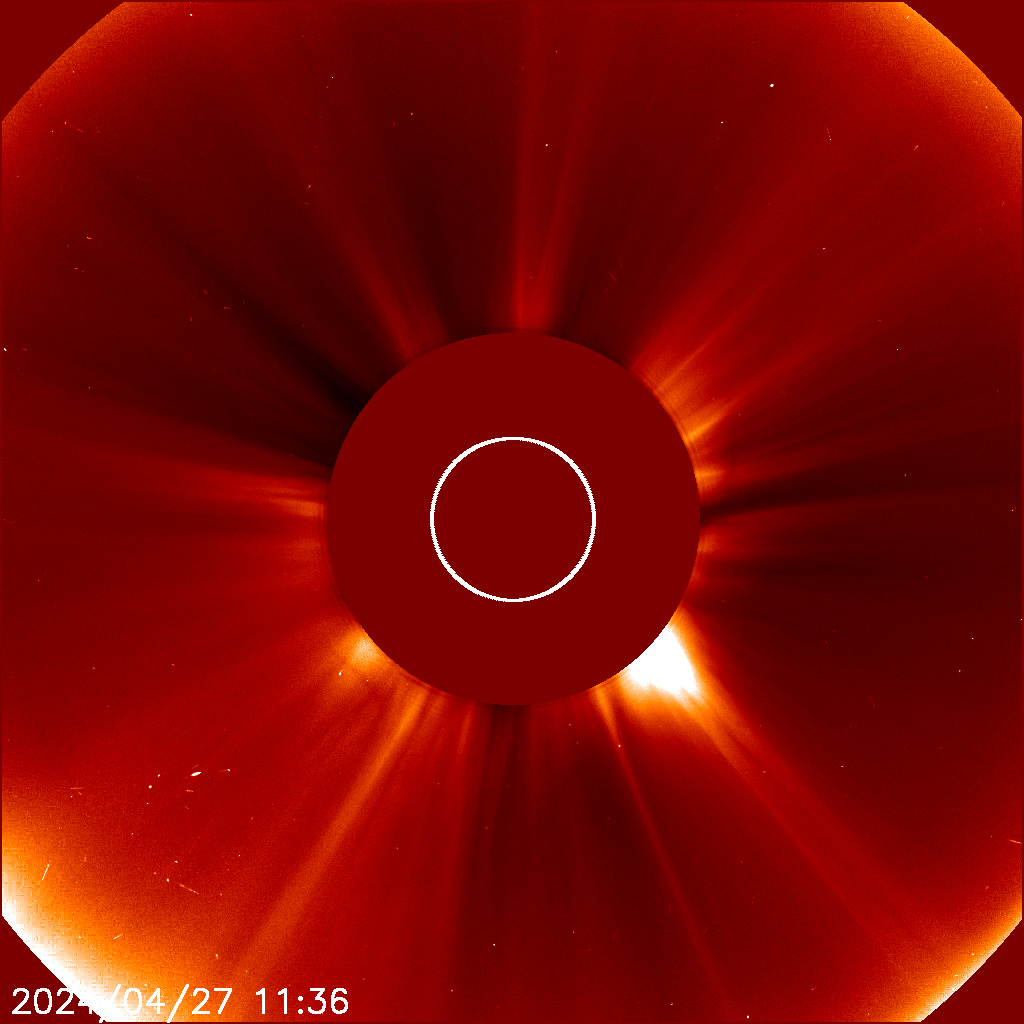
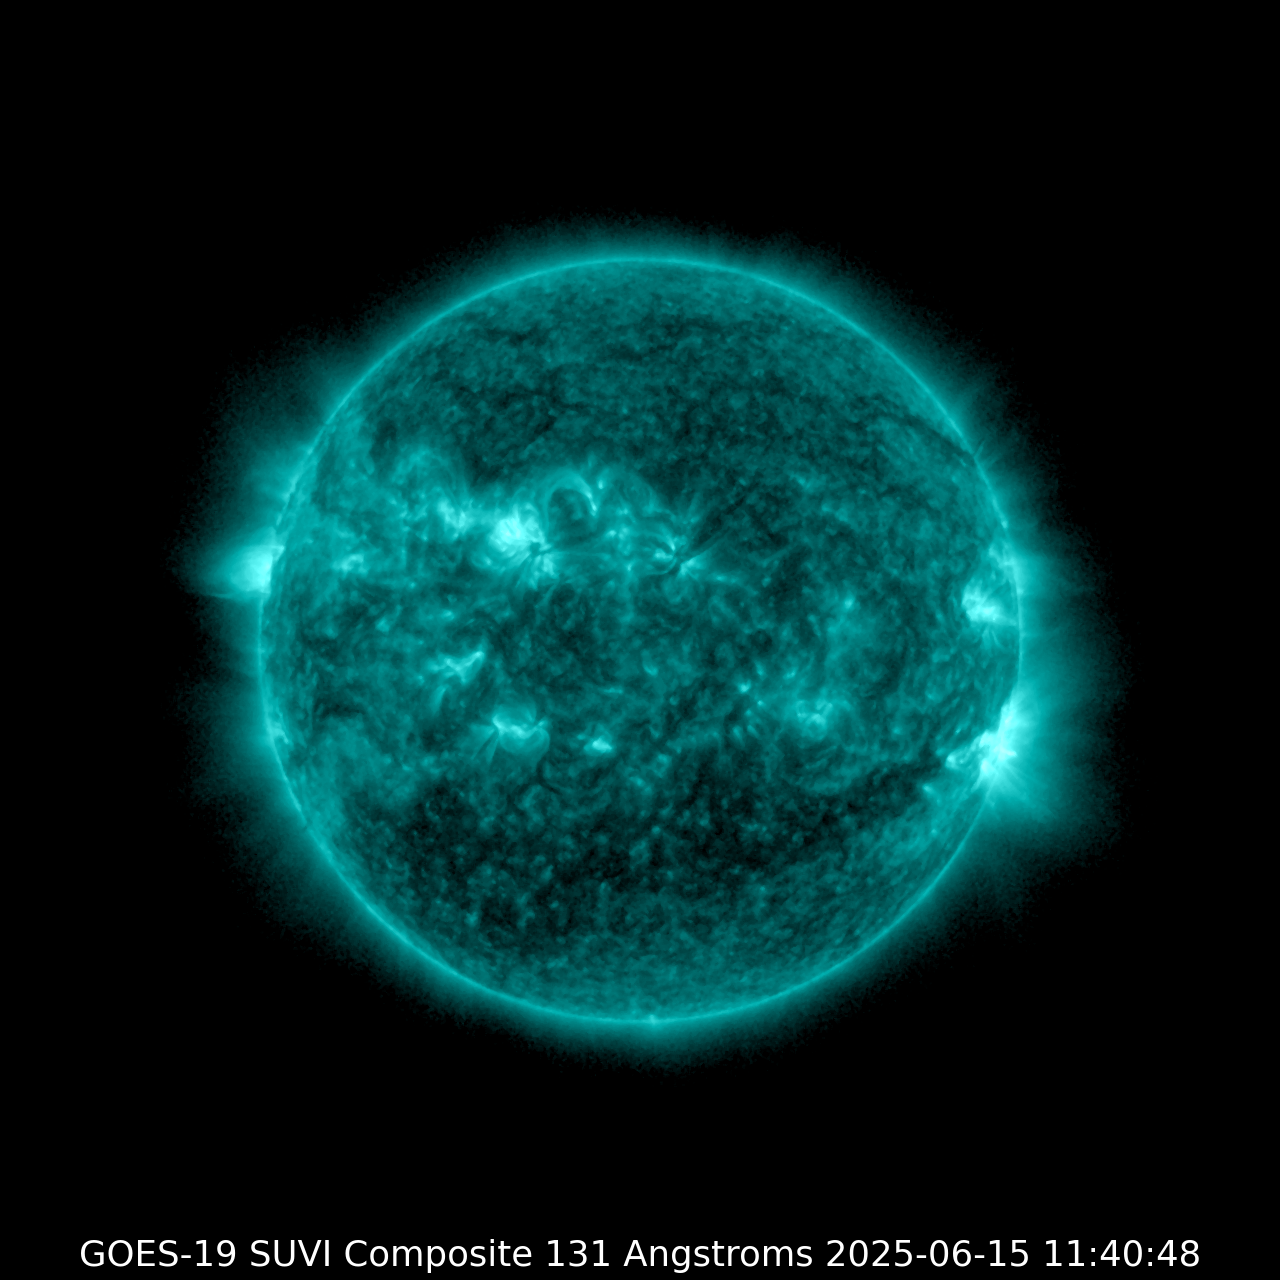
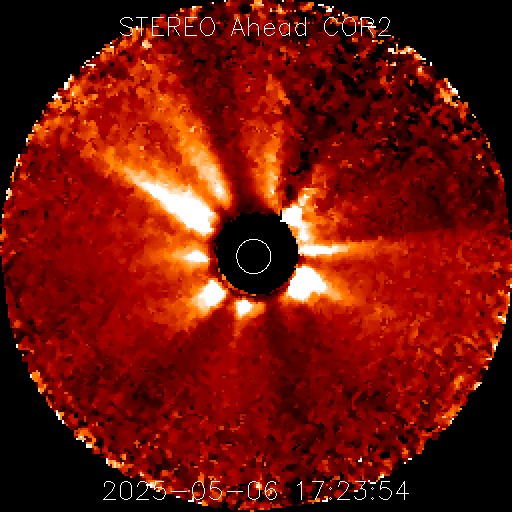
The plot on this page shows us the most recent 24-hour solar X-ray data from the primary GOES satellite. You can zoom in on this plot by selecting a time period that you wish to view and even export the graph as a JPG, PDF, SVG or PNG file. Beneath that we have a collection of live imagery which can be used to pinpoint the location of a solar flare and see if there was a coronal mass ejection. Last but not least we have a list detailing all solar flares that took place today. All times listed are in UTC.
Current value
24h max
72h max
Today's Sun
| C-class solar flare | 99% |
| M-class solar flare | 95% |
| X-class solar flare | 75% |
Events on the Sun past 24 hours
More events in the archive Solar flares | Coronal mass ejections |
|---|---|
|
|
|
|
|
|
Radio Blackout

Latest news

Saturday, 11 May 2024
Strongest geomagnetic storm since 2003, X5.8 solar flare

Saturday, 11 May 2024
Extreme G5 geomagnetic storm

Friday, 10 May 2024
Severe G4 geomagnetic storm
Latest forum messages
May 2024 Geomagnetic Storms from AR 13664 (2) 88Incoming Active Regions 259Unproven theories 406Why is SOHO so grainy right now? 1AR3664 827
More topicsSupport SpaceWeatherLive.com!
A lot of people come to SpaceWeatherLive to follow the Sun's activity or if there is aurora to be seen, but with more traffic comes higher server costs. Consider a donation if you enjoy SpaceWeatherLive so we can keep the website online!

Space weather facts
| Last X-flare | 2024/05/11 | X1.5 |
| Last M-flare | 2024/05/12 | M3.2 |
| Last geomagnetic storm | 2024/05/11 | Kp9 (G5) |
| Spotless days | |
|---|---|
| Last spotless day | 2022/06/08 |
| Monthly mean Sunspot Number | |
|---|---|
| April 2024 | 136.5 +31.6 |
| May 2024 | 139.8 +3.3 |
| Last 30 days | 173.6 +82.2 |