Coronal mass ejection impact expected on 11 November
Friday, 10 November 2023 16:17 UTC
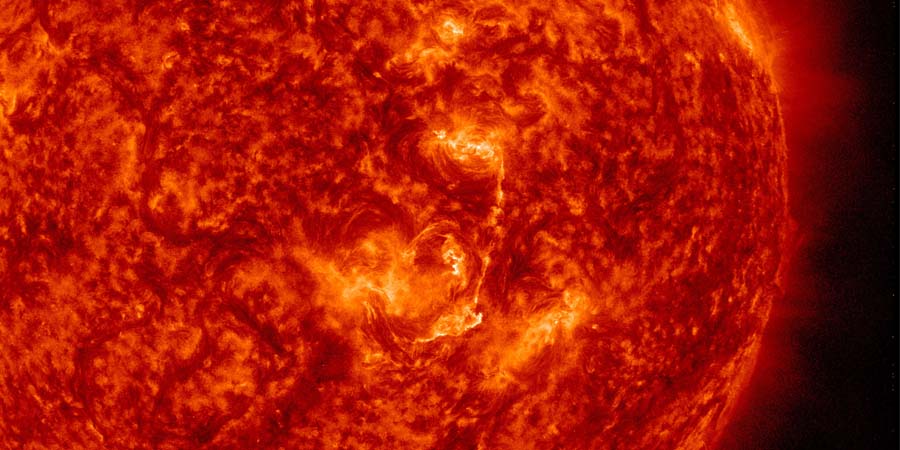
A full halo Coronal Mass Ejection (CME) left the Sun around 12 UTC on 9 November. The CME was the result of a filament eruption close to the center of the earth-facing solar disk.
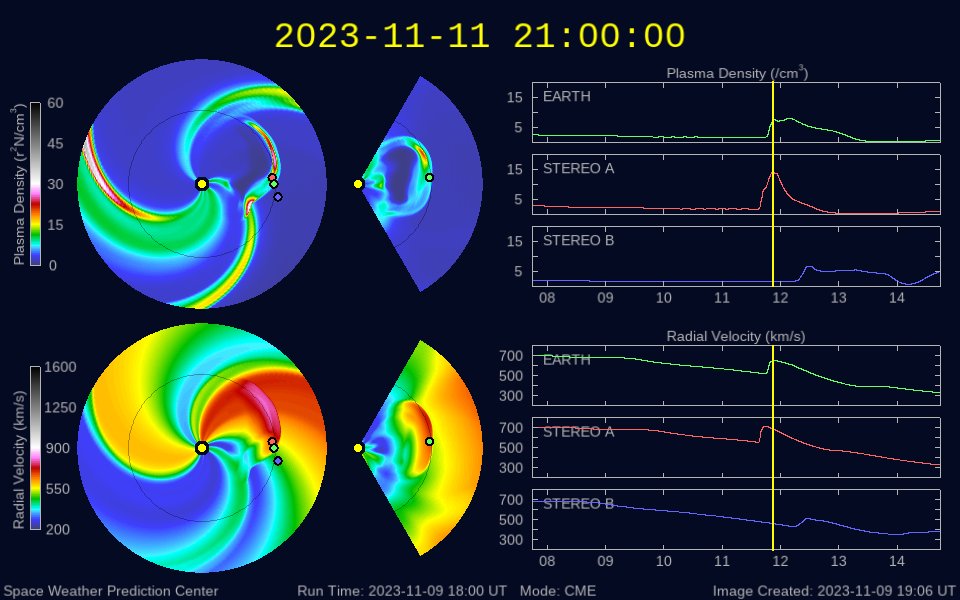
The coronal mass ejection left the Sun at a speed of around 500km/s and will likely interact with a coronal hole solar wind stream as displayed on the ENLIL solar wind model which you can see below. This makes forecasting an estimated arrival time hard but the NOAA SWPC expects the arrival to take place late on 11 November but it would not surprise us if the CME arrives after midnight UTC on 12 November. Minor (G1) to moderate (G2) geomagnetic storm conditions are expected after the plasma cloud arrives.
A filament eruption yesterday launched an asymmetrical full halo coronal mass ejection towards our planet. The cloud of solar plasma is expected to arrive late on 11 November. Minor (G1) to moderate (G2) geomagnetic storm conditions are expected once the CME passes Earth. pic.twitter.com/RBBDwe3iVU
— SpaceWeatherLive (@_SpaceWeather_) November 10, 2023
Thank you for reading this article! Did you have any trouble with the technical terms used in this article? Our help section is the place to be where you can find in-depth articles, a FAQ and a list with common abbreviations. Still puzzled? Just post on our forum where we will help you the best we can!
Latest news

Lot's of sunspots! Big chance for major flare activity?

X1.1 solar flare with earth-directed CME

Sunspot region 3615, G1 watch
Latest forum messages
Support SpaceWeatherLive.com!
A lot of people come to SpaceWeatherLive to follow the Sun's activity or if there is aurora to be seen, but with more traffic comes higher server costs. Consider a donation if you enjoy SpaceWeatherLive so we can keep the website online!

Space weather facts
| Last X-flare | 2024/03/28 | X1.1 |
| Last M-flare | 2024/04/29 | M3.6 |
| Last geomagnetic storm | 2024/04/26 | Kp5+ (G1) |
| Spotless days | |
|---|---|
| Last spotless day | 2022/06/08 |
| Monthly mean Sunspot Number | |
|---|---|
| March 2024 | 104.9 -19.8 |
| Last 30 days | 139 +32.6 |