Have we passed solar minimum?
Sunday, 31 May 2020 14:53 UTC
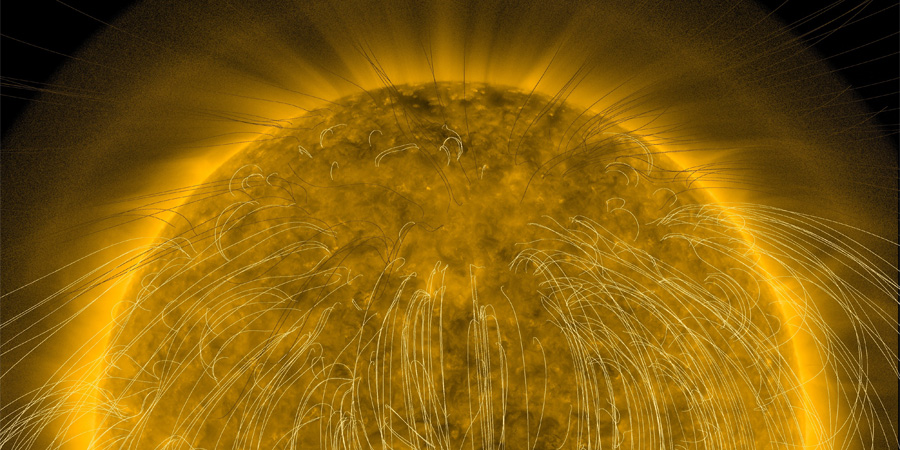
The recent M-class solar flare from a sunspot region that belongs to Solar Cycle 25 was a wake up call for everyone who keeps an eye on the weather in space. Who would have thought that we would see an M-class solar flare while we are so close to solar minimum? Not many of us that's for sure. It raises yet again the question... When is solar minimum, or when was solar minimum? Could we have passed solar minimum? We have seen a couple of Solar Cycle 25 sunspot regions during the past few weeks and this M-class solar flare was another sign that we might have passed solar minimum already? Is Solar Cycle 25 really starting to gain traction? In this news item we will take a look at the evidence and present you with the data we need to draw a preliminary conclusion.
First of all... what is solar minimum and how do we decide when solar minimum took place? Solar minimum is the period of least solar activity in the 11-year solar cycle. The date of the minimum is described by a smoothed average over 13 months of sunspot activity (the sunspot number), from 6 months before to 6 months after a base month. That means we can not call solar minimum for sure until at least 6 months after the minimum takes place. For a more comprehensive explanation be sure to read the text below from the SIDC SILSO website:
The smoothed monthly number results from an averaging of monthly mean values over the 13 months, from 6 months before to 6 months after a base month. All months are weighted equal except for the extreme ones, which are weighted by 1/2. This is expressed by the formula:
Rs= (0.5 Rm-6 + Rm-5 + Rm-4 + Rm-3 + Rm-2 + Rm-1 + Rm + Rm+1 + Rm+2 + Rm+3 + Rm+4 + Rm+5 + 0.5 Rm+6 ) / 12
In signal processing jargon, this would be called a "tapered box-car" smoothing function.
This smoothing formula was introduced in the early 20th century by the Zürich observatory, then in charge of the sunspot number production. It was probably chosen for its simplicity for manual calculations. Today, we know many other smoothing functions, often with better low-pass filtering charactristics. However, as it was used as a standard for so many decades, it remains the base reference allowing an easy comparison of various scientific analyses based on the sunspot number.
Indeed, the smoothed series is meant for two main purposes:
- generating a series that reflects only the overal evolution of each solar cycle, by filtering out the fast variations (random surges and 27-day rotational modulation)
- defining the times of maximum and minimum for each cycle, thus providing the consistent timebase on which other series can be linked to the solar semi-regular periodicity.
NB: as the symmetrical smoothing process requires 6 monthly means around each base month, the smoothed values cannot be calculated for the first and last 6 months of the series. The last smoothed number thus always lags by 6 month behind the latest monthly mean sunspot number.
While we decide when solar minimum took place with the help of the Smoothed Sunspot Number, there is another great benchmark which gives us an idea when solar minimum might have occurred and that is where friend of the website Christian Harris from Space Weather Trackers comes in. Christian is a space weather enthusiast like ourselves with an almost endless knowledge when it comes to space weather. He made a great post on his Space Weather Trackers page yesterday which he kindly shares with us. The latter half of his post is what we are going to focus on where he uses the sun's polar magnetic field strength (see the image below) to determine at what phase of the solar cycle we are currently in. Do read and fling a like at his post and of course follow his Space Weather Trackers page!
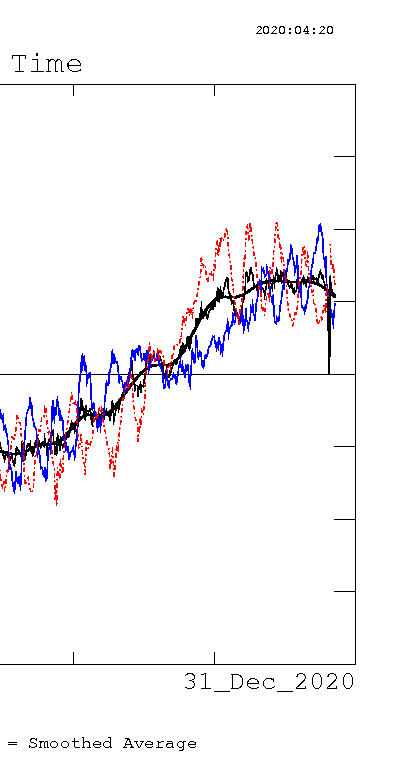
As Christian describes in his post on Space Weather Trackers:
The black line peaks during solar minimum, and goes to zero during solar maximum. The timing between these events are not perfectly aligned, generally once the magnetic field strength begins to drop, the effects are seen through the sunspot numbers beginning to increase months later.
Ignoring the sharp drop in the black line, which was due to the instrumentation being calibrated and no data being taken at the time, it is now clear the average field strength is dropping, and dropping considerably.
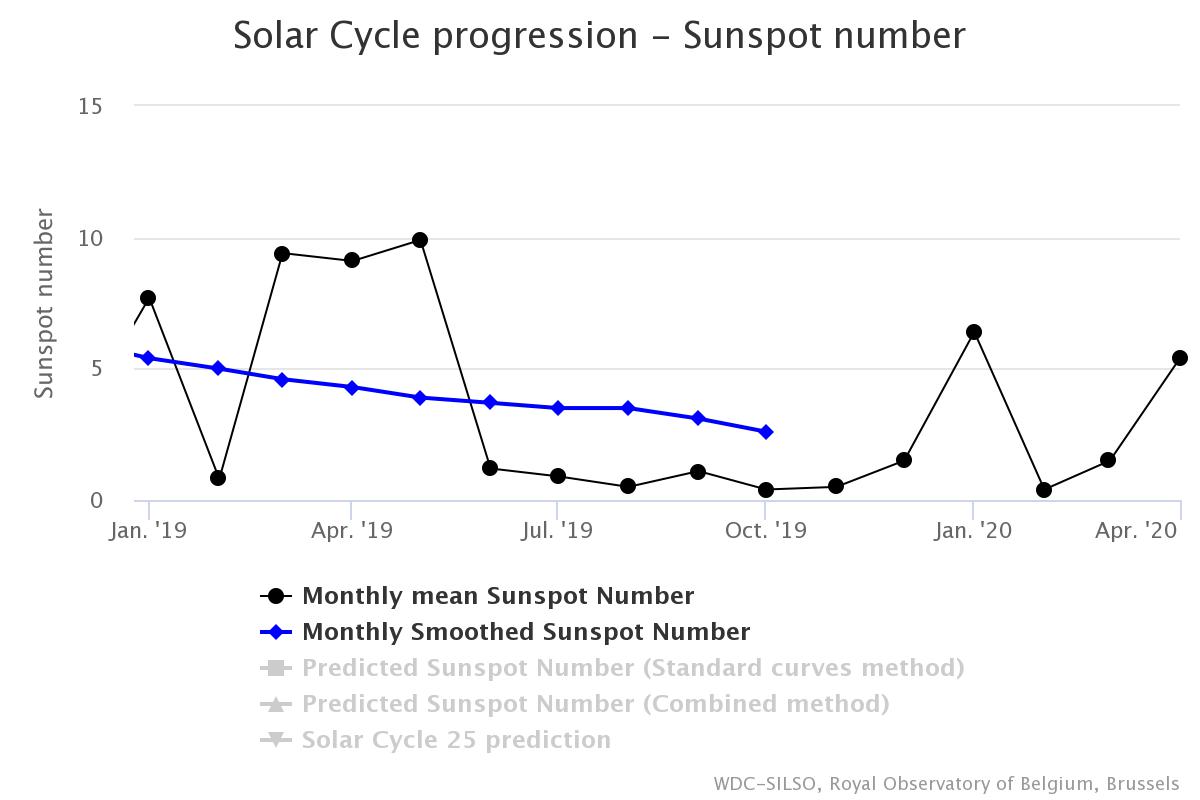
What can we take away from this? First of all if we take a look at the smoothed sunspot number, we first have to take a look at the sunspot number for each individual month. We can see here and on the image below that we had very low sunspot numbers between June and December of 2019. In January and April of this year the sunspot numbers were considerably higher. Based on the data available right now, we can estimate that December 2019 could have been the month of solar minimum. The graph of the Sun's polar magnetic field strength only fuels this theory as we could see earlier in this post how the sun's polar magnetic field strength has been dropping during the past few months indicating Solar Cycle 25 like already has begun. Two indicators pointing in the same direction: solar minimum has passed. Do not expect major solar activity in the months ahead, it is really still too early for that but there is light at the end of the tunnel. We cant wait to see what the years ahead will bring but we are glad you are following us along for the ride!
Thank you for reading this article! Did you have any trouble with the technical terms used in this article? Our help section is the place to be where you can find in-depth articles, a FAQ and a list with common abbreviations. Still puzzled? Just post on our forum where we will help you the best we can!
Latest news

Lot's of sunspots! Big chance for major flare activity?

X1.1 solar flare with earth-directed CME

Sunspot region 3615, G1 watch
Latest forum messages
Support SpaceWeatherLive.com!
A lot of people come to SpaceWeatherLive to follow the Sun's activity or if there is aurora to be seen, but with more traffic comes higher server costs. Consider a donation if you enjoy SpaceWeatherLive so we can keep the website online!

Space weather facts
| Last X-flare | 2024/03/28 | X1.1 |
| Last M-flare | 2024/04/27 | M3.0 |
| Last geomagnetic storm | 2024/04/26 | Kp5+ (G1) |
| Spotless days | |
|---|---|
| Last spotless day | 2022/06/08 |
| Monthly mean Sunspot Number | |
|---|---|
| March 2024 | 104.9 -19.8 |
| Last 30 days | 137.7 +30.3 |