G2 storm, Sunspots, Website addition
Wednesday, 29 March 2017 12:12 UTC
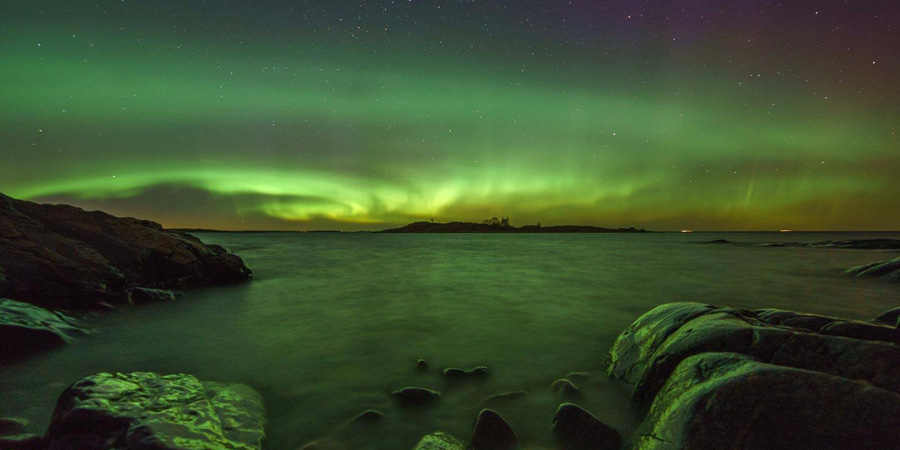
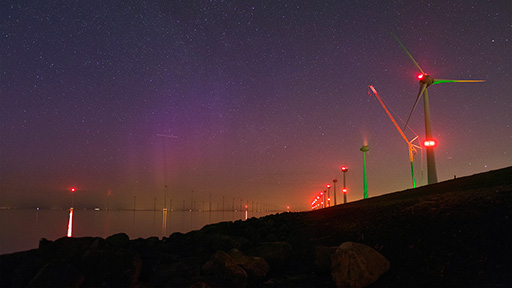
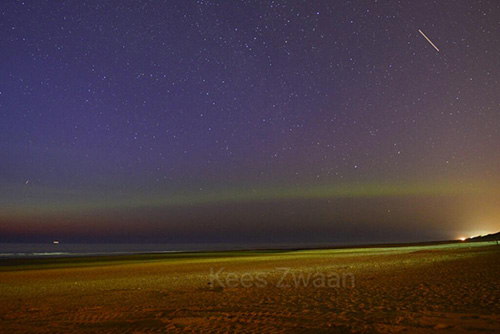
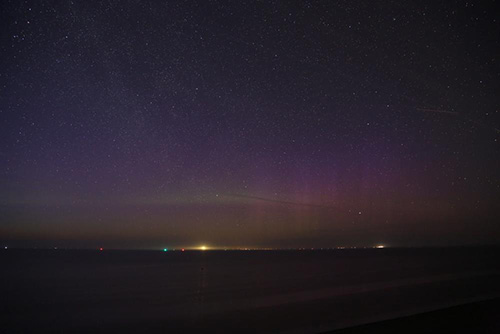
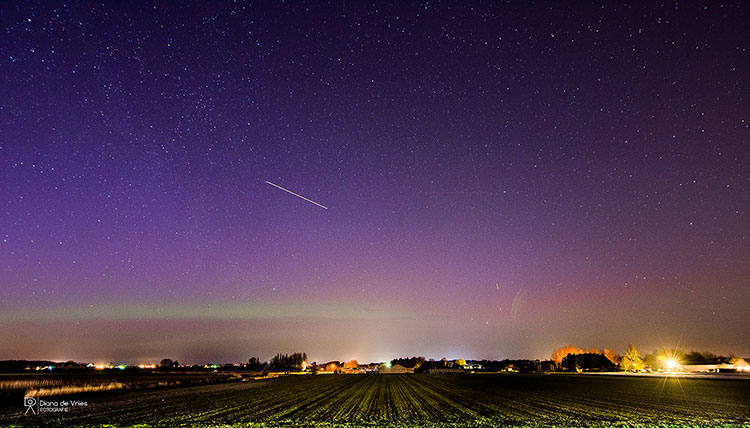
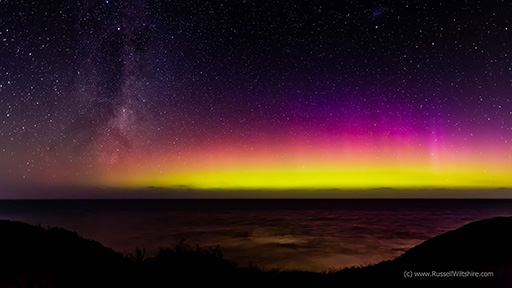
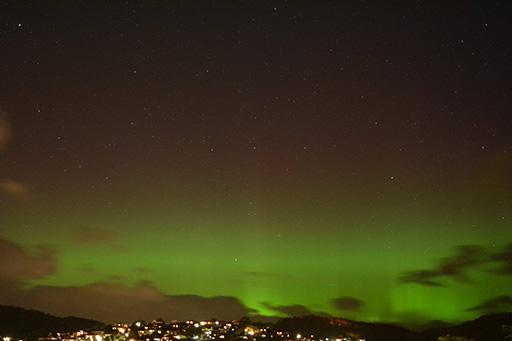
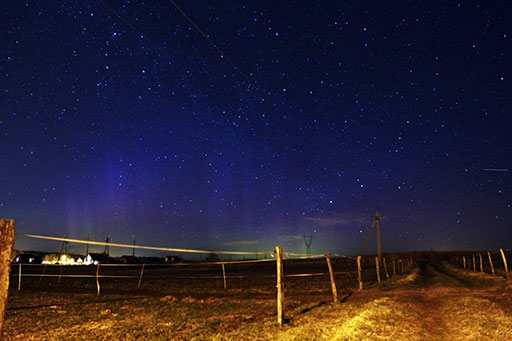
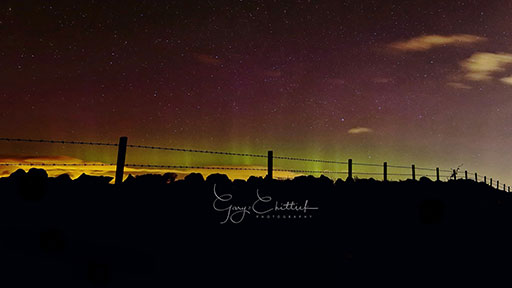
The coronal hole solar wind stream packed a punch last Monday as we predicted and caused two 3-hour periods where we reached the moderate G2 geomagnetic storm threshold. The northern lights put on a grand display and were seen from latitudes as low as the Netherlands, Germany and Poland in Europe and the southern lights were seen from Victoria, Australia! Below we have a small selection of images made during the past few days. The header image used in this article was made by Carita Holmberg from Grisslehamn, Sweden.
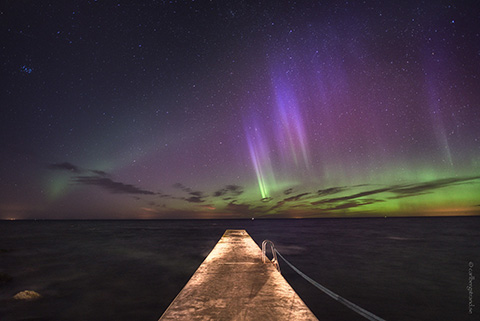
⇩ Carl Bergstrand (Gotland, Sweden)
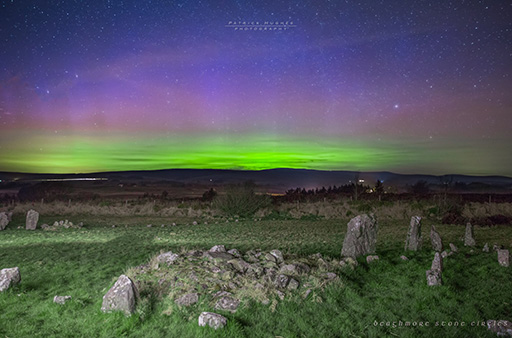
⇩ Patrick Hughes Photography (Beaghmore Stone Circles, Northern Ireland)
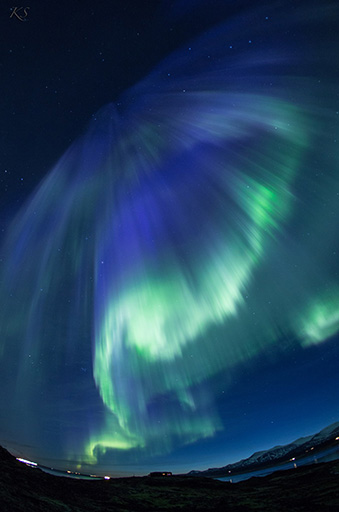
⇩ KotyS Photography (Iceland)
⇩ Ide Geert Koffeman (The Netherlands)
⇩ Kees Zwaan (The Netherlands)
⇩ Maurice Hamming (The Netherlands)
⇩ Diana de Vries (The Netherlands)
⇩ Russell Wiltshire Photography (Point Addis Victoria, Australia)
⇩ Lee Mackay (Hobart, Tasmania, Australia)
⇩ Artur Kwiatkowski (Poland)
⇩ Gary Chittick (Scotland)
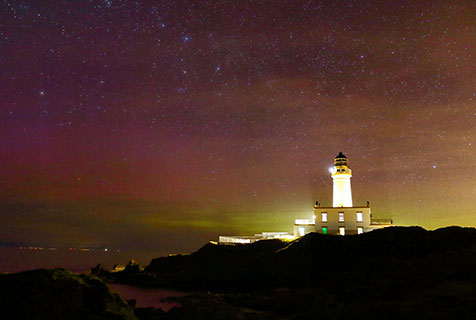
⇩ Gary Chittick (Scotland)
Sunspot regions
The Sun isn't spotless anymore! A couple of sunspot regions popped up the last few days and they even gave us a couple of C-class solar flares! Sunspot regions 2644 and 2645 both gave us some C-class solar flares on Monday and Tuesday but they have gone silent today with only B-class activity.
Both sunspot regions were fairly compact when they produced the C-class activity but both are showing signs of magnetic separation, severely reducing the chance for further C-class solar flares. An isolated low-level C-class solar flare can not be excluded but the odds aren't high at all. M or X-class activity is very unlikely.
Nonetheless it is good to see some sunspots on our nearest star as they will become less and less common as we head towards solar minimum. For a live view of the Sun and all of its sunspot regions go check out this page.
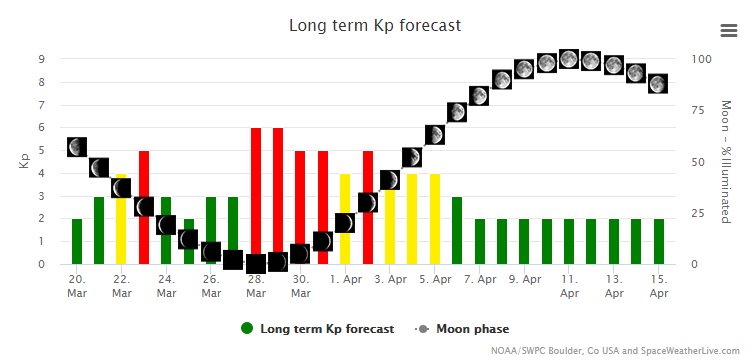
Long term Kp forecast graph addition
We combined the long term Kp forecast graph with information about the upcoming moon phases. This will make it easy to spot when the next geomagnetic storm is expected and if the Moon will be a disturbing factor! Handy we think! Go check it out by following this link.
Thank you for reading this article! Did you have any trouble with the technical terms used in this article? Our help section is the place to be where you can find in-depth articles, a FAQ and a list with common abbreviations. Still puzzled? Just post on our forum where we will help you the best we can!
Latest news

Lot's of sunspots! Big chance for major flare activity?

X1.1 solar flare with earth-directed CME

Sunspot region 3615, G1 watch
Latest forum messages
Support SpaceWeatherLive.com!
A lot of people come to SpaceWeatherLive to follow the Sun's activity or if there is aurora to be seen, but with more traffic comes higher server costs. Consider a donation if you enjoy SpaceWeatherLive so we can keep the website online!

Space weather facts
| Last X-flare | 2024/03/28 | X1.1 |
| Last M-flare | 2024/04/25 | M1.3 |
| Last geomagnetic storm | 2024/04/19 | Kp7 (G3) |
| Spotless days | |
|---|---|
| Last spotless day | 2022/06/08 |
| Monthly mean Sunspot Number | |
|---|---|
| March 2024 | 104.9 -19.8 |
| Last 30 days | 135.5 +27.6 |