CME arrival? G1 geomagnetic storm
Friday, 11 March 2016 13:38 UTC
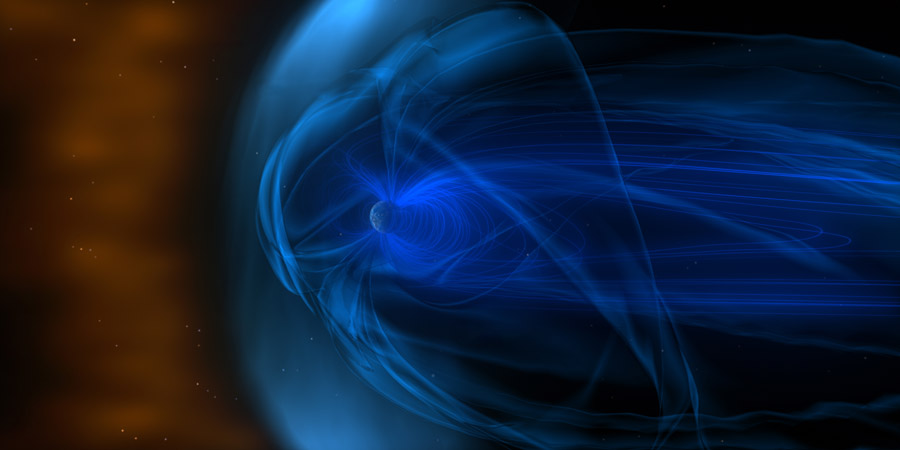
Just after 04:00 UTC this night we saw a slight rise in the solar wind speed and density. Since then, the IMF strength slowly increased to values well over 25nT! At the moment the strength of the IMF remains close to 20nT which is a moderately high value. These enhanced solar wind conditions are likely caused by a coronal mass ejection passing our planet.
Our prime suspect is a faint coronal mass ejection from 6 March that came from a B7.2 solar flare near sunspot regions 2512 and 2514. We mentioned this coronal mass ejection in a news item on 6 March but we did not think it would arrive at Earth at the time. Click here to see that news article. It's far from a impressive coronal mass ejection but it would be the most logical explanation for now. The animation below shows the coronal mass ejection from the B7.2 solar flare as seen by ESA/NASA SOHO/LASCO:
An event from 8 March is also a suspect (center disk dimming seen on SDO) but there isn't any sign of an obvious coronal mass ejection on the LASCO coronagraph images. The current solar wind speed also suggest a slow transit. If this coronal mass ejection left the Sun only three days ago we would expect to see a higher solar wind speed at Earth right now so a slower CME that left the Sun 5 days ago sounds more plausible right now.
A coronal hole solar wind stream is also expected to arrive today but it is unlikely that the current solar wind and IMF conditions are the result of only a coronal hole solar wind stream. The current solar wind and IMF values are rather impressive and unlikely the result of such a small coronal hole.
The NOAA SWPC reported that the minor G1 geomagnetic storm threshold has been reached. Depending on how this events unfolds, we can not exclude more periods where we reach the minor G1 geomagnetic storm threshold. Be sure to follow this event live here on our website.
Thank you for reading this article! Did you have any trouble with the technical terms used in this article? Our help section is the place to be where you can find in-depth articles, a FAQ and a list with common abbreviations. Still puzzled? Just post on our forum where we will help you the best we can!
Latest news

Lot's of sunspots! Big chance for major flare activity?

X1.1 solar flare with earth-directed CME

Sunspot region 3615, G1 watch
Latest forum messages
Support SpaceWeatherLive.com!
A lot of people come to SpaceWeatherLive to follow the Sun's activity or if there is aurora to be seen, but with more traffic comes higher server costs. Consider a donation if you enjoy SpaceWeatherLive so we can keep the website online!

Space weather facts
| Last X-flare | 2024/03/28 | X1.1 |
| Last M-flare | 2024/04/27 | M2.1 |
| Last geomagnetic storm | 2024/04/26 | Kp5+ (G1) |
| Spotless days | |
|---|---|
| Last spotless day | 2022/06/08 |
| Monthly mean Sunspot Number | |
|---|---|
| March 2024 | 104.9 -19.8 |
| Last 30 days | 136.8 +28.6 |