Najczęściej zadawane pytania (FAQ)
Jednym z najważniejszych zadań, które mamy tu na SpaceWeatherLive jest to, że nasi goście dowiedzieć się o kosmicznej pogody, gdy odwiedzają naszą stronę internetową. To jest właśnie powód, dla którego mamy dużą część pomocy z wielu artykułów, gdzie kopać głębiej w świecie pogody kosmicznej. Jednak nadal otrzymaliśmy wiele pytań są na SpaceWeatherLive a niektóre z tych pytań wrócić tak często. Pytania, które otrzymaliśmy najczęściej można teraz znaleźć w tym FAQ.
Aktywność słoneczna
Solar flares can not only differ dramatically in strength but also in duration. Some solar flares last for hours and others last only a couple of minutes. Long duration solar flares are often (but not always!) accompanied by an ejection of solar plasma. This is what we call a coronal mass ejection. Solar flares that aren’t very long in duration (impulsive) can still launch a coronal mass ejection but this is fairly rare, and if they do, these coronal mass ejections are often not as strong as coronal mass ejections that are launched during long duration events.
There isn’t an exact time limit that a solar flare needs to reach in order for it to be classified as a long duration event but the American NOAA SWPC classifies a solar flare as a long duration event if the solar flare is still in progress 30 minutes after it started.
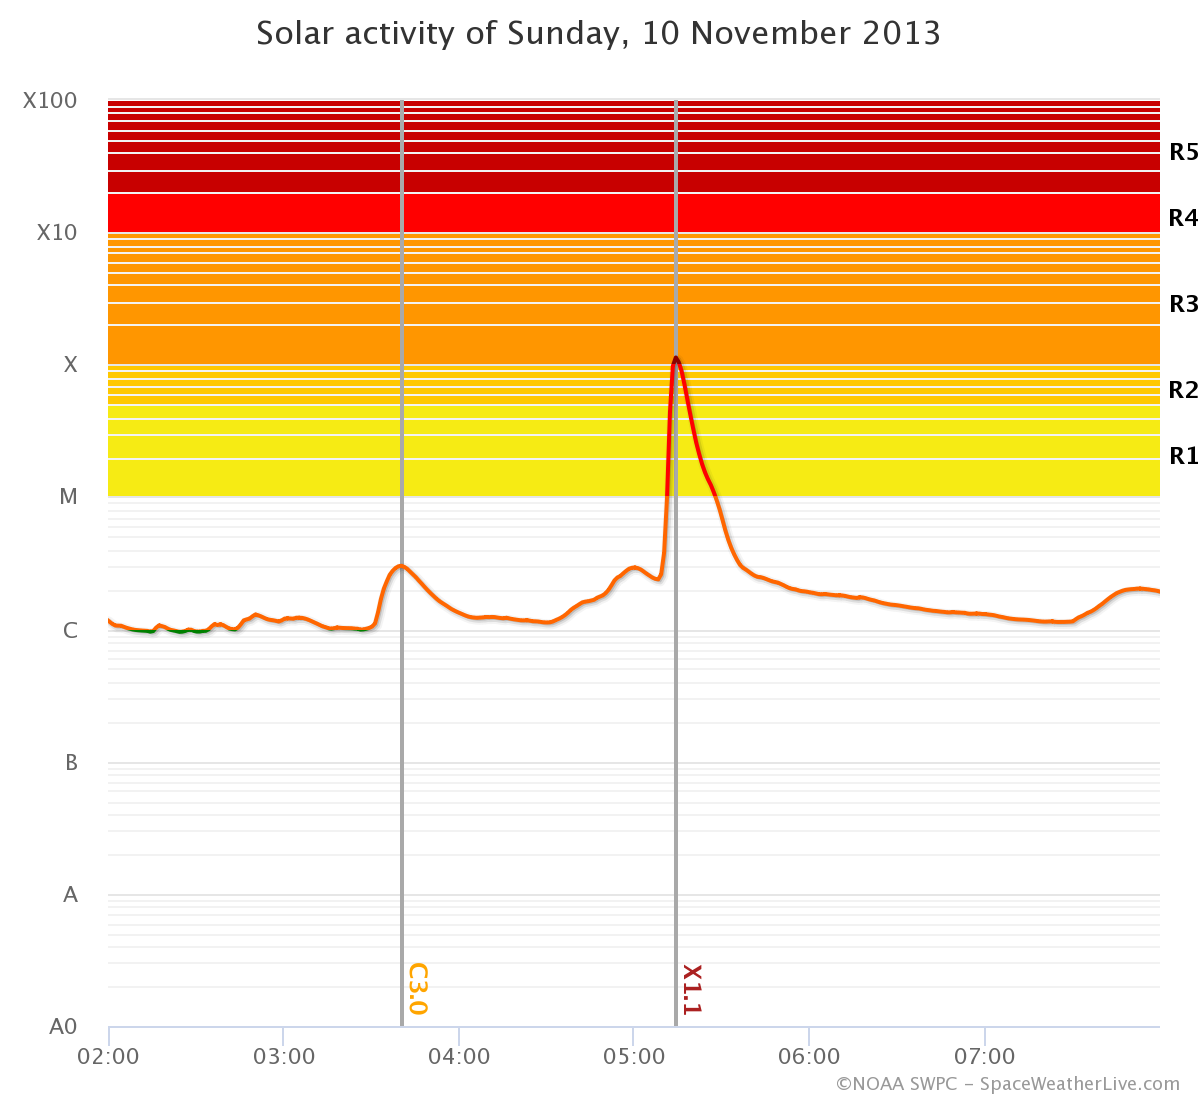
Image: Example of an impulsive solar flare.
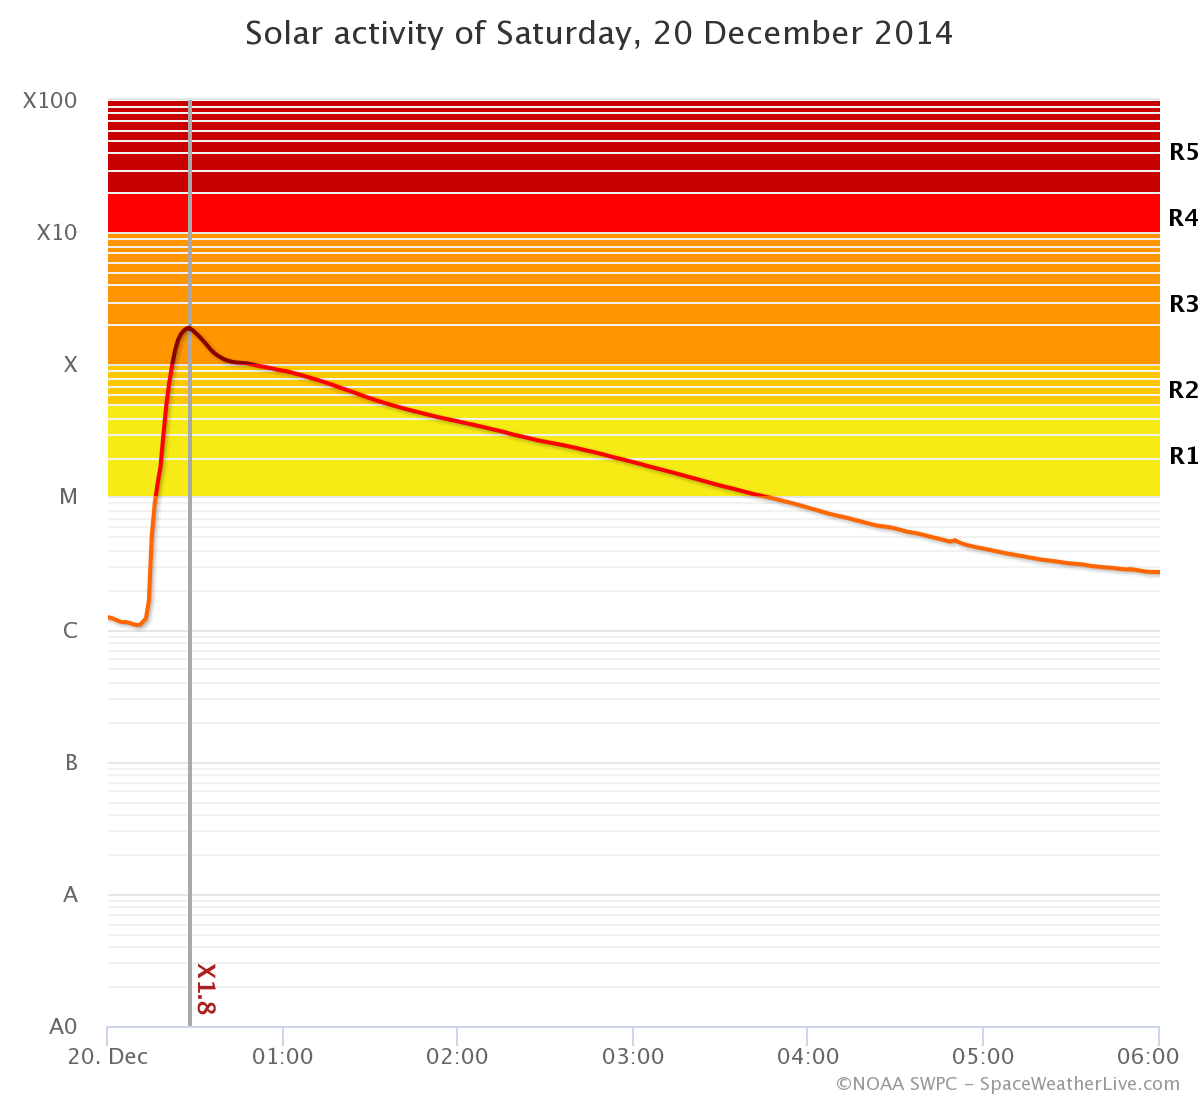
Image: Example of a long duration solar flare.
Image: The Parker Spiral.
NASA’s Solar Dynamics Observatory is in a geosynchronous orbit around our planet. From there it normally has an uninterrupted view of the Sun. However, twice a year near the equinoxes the Earth blocks SDO’s view of the Sun for a period of time each day. These eclipses are fairly short near the beginning and end of these three week eclipse seasons but ramp up to 72 minutes in the middle. If you see an image from SDO that is completely black then you are likely looking at Earth!
Sometimes you might be lucky enough to see a much smaller object on the images from NASA’s Solar Dynamics Observatory: the Moon! The Moon can also appear on images from NASA’s Solar Dynamics Observatory but it will never block the entire Sun for a very long time like Earth does.
Animation: The Earth blocks SDO’s view of the Sun.
Animation: The Moon blocks SDO’s view of the Sun.
To determine the magnetic polarity of sunspots and a sunspot group’s magnetic classification we use magnetogram imagery from the SDO/HMI instrument. This is a line-of-sight magnetogram even though the magnetic field of the Sun is 3D. This makes it impossible to accurately determine a sunspot region’s magnetic layout near the limbs due to projection effect as the polarity of sunspots seem to change near the limbs.
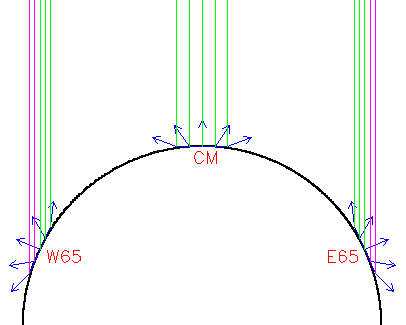
Image: Projection effect.
Difference images are created by subtracting one image from the foregoing picture. This shows what has changed from one frame to the other and are commonly used when analyzing solar events. Coronal mass ejections and their exact trajectory can sometimes be hard to spot using regular imagery making difference imagery often an invaluable tool. Solar eruptions are also much easier to spot and analyze with difference imagery.
Animation: Difference imagery from SDO of an eruption in 2015.
Animation: Difference imagery from SOHO/LASCO of a coronal mass ejection in 2017.
Aktywność zorzowa
Any location on the high latitudes will be able to see auroras with a Kp of 4. For any location on the middle latitudes a Kp-value of 7 is needed. The low latitudes need Kp-values of 8 or 9. The Kp-value that you need of course depends on where you are located on Earth. We made a handy list which is a good guide for what Kp-value you need for any given location within the reach of the auroral ovals.
Important! Note that the locations below give you a reasonable chance to see auroras for the given Kp-index provided local viewing conditions are good. This includes but is not limited to: a clear sight towards the northern or southern horizon, no clouds, no light pollution and complete darkness.
| Kp | Visible from |
|---|---|
| 0 | Ameryka Północna: Europe: |
| 1 | Ameryka Północna: Europe: |
| 2 | Ameryka Północna: Europe: |
| 3 | Ameryka Północna: Europe: |
| 4 | Ameryka Północna: Europe: |
| 5 | Ameryka Północna: Europe: Southern Hemisphere: |
| 6 | Ameryka Północna: Europe: Southern Hemisphere: |
| 7 | Ameryka Północna: Europe: Southern Hemisphere: |
| 8 | Ameryka Północna: Europe: Asia: Southern Hemisphere: |
| 9 | Ameryka Północna: Europe: Asia: Southern Hemisphere: |
There is no difference between Kp5 and G1. NOAA uses a five-level system called the G-scale, to indicate the severity of both observed and predicted geomagnetic activity. This scale is used to give a quick indication of the severity of a geomagnetic storm. This scale ranges from G1 to G5, with G1 being the lowest level and G5 being the highest level. Conditions below storm level are labelled as G0 but this value is not commonly used. Every G-level has a certain Kp-value associated with it. This ranges from G1 for a Kp-value of 5 to G5 for a Kp-value of 9. The table below will help you with that.
| G-scale | Kp | Aktywność zorzowa | Average frequency |
|---|---|---|---|
| G0 | 4 and lower | Below storm level | |
| G1 | 5 | Słaba burza | 1700 per cycle (900 days per cycle) |
| G2 | 6 | Średni burzy | 600 per cycle (360 days per cycle) |
| G3 | 7 | Silna burza | 200 per cycle (130 days per cycle) |
| G4 | 8 | Severe storm | 100 per cycle (60 days per cycle) |
| G5 | 9 | Ekstremalne burzy | 4 per cycle (4 days per cycle) |
Other questions
Earth has about 24 time zones. We say "about" because some countries or regions use local times that deviate half on hour from these zones. However, as soon as we talk about space weather or even science in general, there is really only one time that matters and that is the Coordinated Universal Time (UTC). You will find this time everywhere on our website. Use the map below te see the difference between the UTC time and the time zone that you are in. Click on the image to view a larger version.

Image: Standard time zones of the world. Source: Wikimedia Commons.
Let's work with some examples: imagine you are in Vancouver, Canada in the Pacific Standard Time time zone. According to the UTC time, it is 21 UTC. To convert the UTC time to our local time we have to subtract 8 hours from the UTC time. 21 minus 8 results in a local time of 13 PST. During daylight saving time (Pacific Daylight Time) we subtract 7 hours from the UTC time and that results in a local time of 14 PDT.
Let's try again but this time we are in Amsterdam, the Netherlands. To convert 21 UTC to our local time we add 1 hour and that results in a local time of 22h. During daylight saving time we add 2 hours and that results in a local time of 23h.
Do keep in mind the date when converting UTC to your local time. We once again take Vancouver, Canada as an example: it currently is 14 November, 02h UTC time. This results in 18h on 13 November local time in Vancouver, Canada.
O stronie
Najnowsze wiadomości

Lot's of sunspots! Big chance for major flare activity?

X1.1 solar flare with earth-directed CME

Sunspot region 3615, G1 watch
Najnowsze wiadomości z forum
Wesprzyj SpaceWeatherLive.com!
Wielu ludzi odwiedza SpaceWeatherLive aby śledzić aktywność słoneczną lub sprawdzić czy jest szansa na zaobserwowanie zorzy polarnej. Niestety, większy ruch na stronie oznacza większe koszty utrzymania serwera. Dlatego, jeśli jesteś zadowolony ze strony SpaceWeatherLive, zachęcamy do wspierania nas finansowo. Dzięki temu będziemy mogli utrzymać naszą stronę.

Fakty na temat pogody kosmicznej
| Ostatnie rozbłyski klasy X | 2024/03/28 | X1.1 |
| Ostatnie rozbłyski klasy M | 2024/04/25 | M1.3 |
| Ostatnia burza geomagnetyczna | 2024/04/26 | Kp5+ (G1) |
| Spotless days | |
|---|---|
| Ostatni dzień bez skazy | 2022/06/08 |
| Monthly mean Sunspot Number | |
|---|---|
| marca 2024 | 104.9 -19.8 |
| Last 30 days | 136.8 +28.6 |