Magnetometry
Zakłócenia Burza Czas indeks
Zaburzenie Burza czasu (DST) Indeks jest miarą aktywności geomagnetyczne wykorzystane do oceny nasilenia geomagnetyczne burze. Jest on wyrażony w nanoteslach i jest oparta na średniej wartości składowej poziomej pola magnetycznego mierzonego w czterech prawie równikowej geomagnetycznymi monitorujących. Mierzy wzrost i regenerację prądu ringu w magnetosfery Ziemi. Niższa te wartości, tym bardziej energia jest magazynowana w magnetosfery Ziemi.
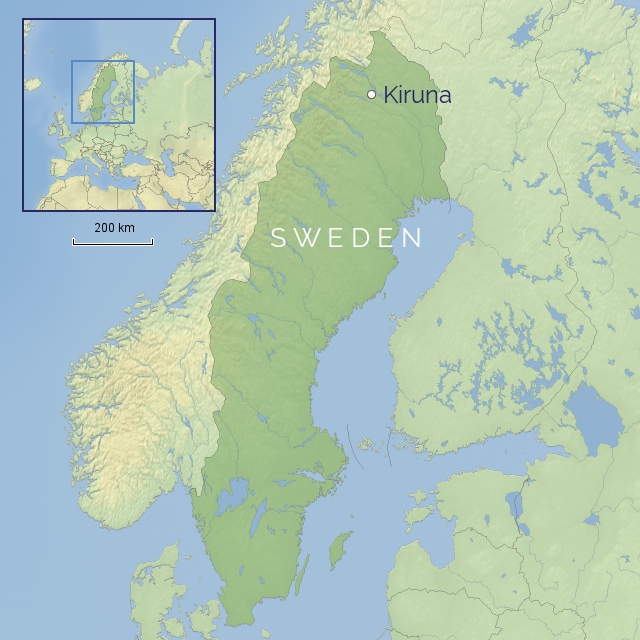
Kiruna (Sweden) Pomoc
This magnetogram gives you the values measured by the ground station of Kiruna (Sweden, Europa). For European middle latitude auroral activity the deflection in the magnetometer data should be more than 1300nT. If you are not located in Europe, please consult a magnetometer near your location for a more accurate representation of the current geomagnetic activity.
| K-index | Deflection in nanoTesla | Storm type |
|---|---|---|
| 0 | 0 - 15 | Quiet geomagnetic conditions |
| 1 | 15 - 30 | Quiet geomagnetic conditions |
| 2 | 30 - 60 | Quiet geomagnetic conditions |
| 3 | 60 - 120 | Unsettled geomagnetic conditions |
| 4 | 120 - 210 | Aktywne warunki geomagnetyczne |
| 5 | 210 - 360 | G1 - słaba burza geomagnetyczna |
| 6 | 360 - 600 | G2 - średnia burza geomagnetyczna |
| 7 | 600 - 990 | G3 - silna burza geomagnetyczna |
| 8 | 990 - 1500 | G4 - poważna burza geomagnetyczna |
| 9 | 1500 and more | G5 - ekstremalna burza geomagnetyczna |
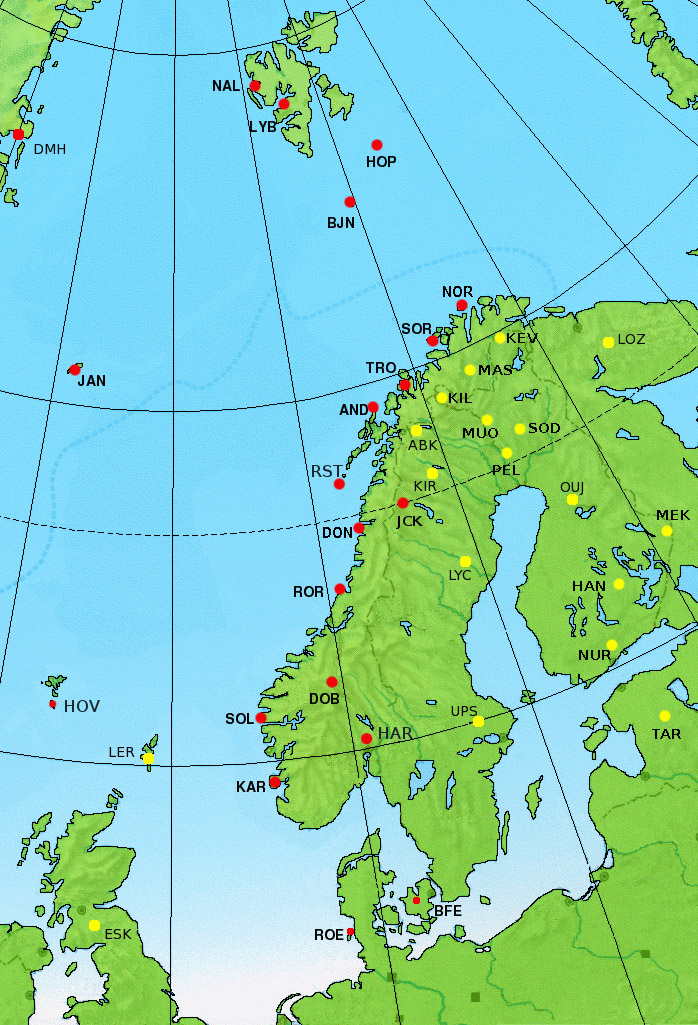
Stackplot (Europe)
This plot shows several magnetometers that are located in Norway, Denmark and Finland, ranked according to their latitude. When a geomagnetic disturbance starts the most northern magnetometers will respond and as the disturbance strengthens the lower magnetometers will respond as well. Once the stations Dombås (DOB) and Solund (SOL) react, there will be a chance for the European middle latitudes to see aurora low at the northern horizon.
Data from Tromsø Geophysical Observatory (TGO), DTU Space (Technical University of Denmark) and Finnish Meteorological Institute (FMI).
| Code | Imię | Położenie | Geographic latitude | Geographic longitude |
|---|---|---|---|---|
| NAL | Ny-Ålesund | Svalbard | 78.92N | 11.93E |
| LYR | Longyearbyen | Svalbard | 78.20N | 15.83E |
| HOP | Hopen | Svalbard | 76.51N | 25.01E |
| BJN | Bjørnøya | Svalbard | 74.50N | 19.00E |
| NOR | Nordkapp | Norway | 71.09N | 25.79E |
| SOR | Sørøya | Norway | 70.54N | 22.22E |
| TRO | Tromsø | Norway | 69.66N | 18.94E |
| KIL | Kilpisjarvi | Finland | 69.07N, | 20.76E |
| AND | Andenes | Norway | 69.30N | 16.03E |
| RST | Røst | Norway | 67.52N | 12.09E |
| JCK | Jäckvik | Sweden | 66.40N | 16.98E |
| DON | Dønna | Norway | 66.11N | 12.50E |
| RVK | Rørvik | Norway | 64.95N | 10.99E |
| DOB | Dombås | Norway | 62.07N | 9.11E |
| SOL | Solund | Norway | 61.08N | 4.84E |
| HAR | Harestua | Norway | 60.21N | 10.75E |
| KAR | Karmøy | Norway | 59.21N | 5.24E |
| BFE | Brorfelde | Denmark | 55.63N | 11.67E |
| ROE | Rømø | Denmark | 55.17N | 8.55E |
| WIC | Vienna | Austria | 47.92N | 15.85E |
| TDC | Tristan da Cunha | South Atlantic | -37.06N | 347.68E |
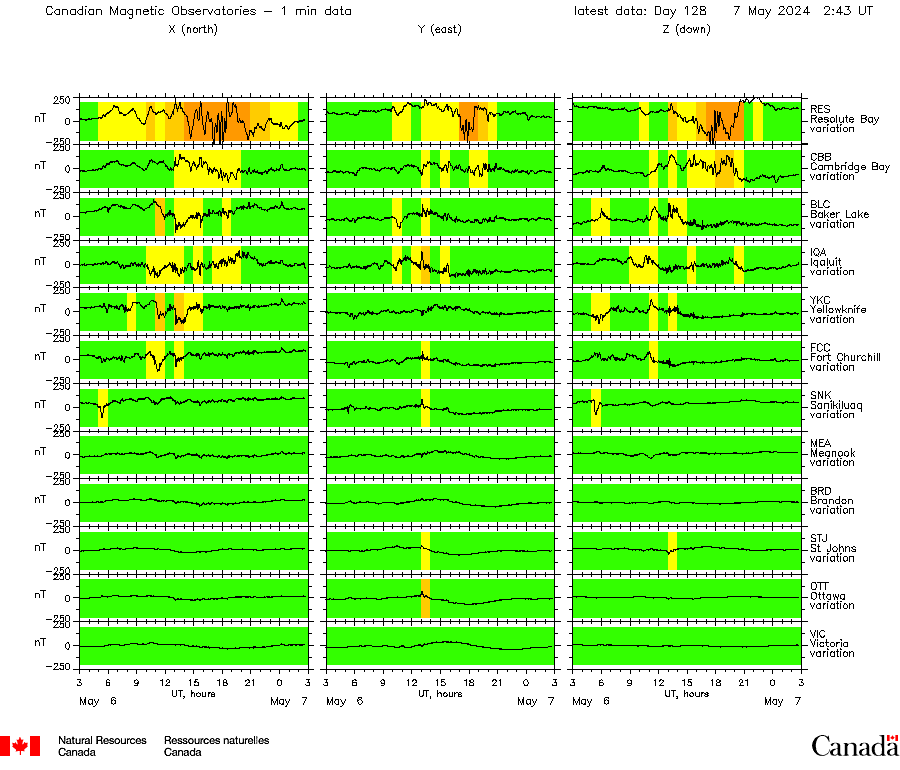
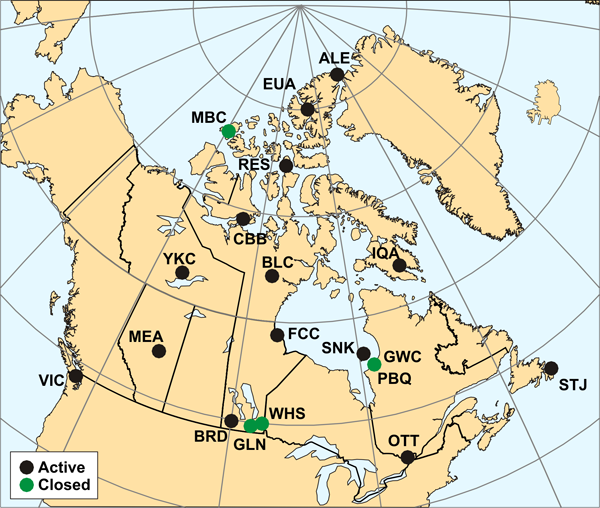
CANadian Magnetic Observatory System (Canada)
This diagram shows the data for the last 24 hours from the CANadian Magnetic Observatory System (CANMOS). For each station, the X (north), Y (east) and Z (vertical down) components of the magnetic field are shown. Stations are displayed starting with the most northerly at the top progressing down in decreasing latitude. Universal Time is used. All frames use the same scale (which automatically adjusts to cover the largest variation), so that the relative strengths of the field at different stations can be readily compared. The background colour changes as the general level of activity varies, with green for quiet, yellow, orange and red for increasing levels of activity.
Credit: Geological Survey of Canada.
| Code | Imię | Latitude (°) | Longitude (°) |
|---|---|---|---|
| BLC | Baker Lake | 64.318 | 263.988 |
| BRD | Brandon | 49.870 | 260.026 |
| CBB | Cambridge Bay | 69.123 | 254.969 |
| EUA | Eureka | 80.000 | 274.100 |
| FCC | Fort Churchill | 58.759 | 265.912 |
| IQA | Iqaluit | 63.753 | 291.482 |
| MEA | Meanook | 54.616 | 246.653 |
| OTT | Ottawa | 45.403 | 284.448 |
| RES | Resolute Bay | 74.690 | 265.105 |
| SNK | Sanikiluaq | 56.500 | 280.800 |
| STJ | St Johns | 47.595 | 307.323 |
| VIC | Victoria | 48.520 | 236.580 |
| YKC | Yellowknife | 62.480 | 245.518 |
Stackplot (Ameryka Północna)
This plot shows several magnetometers that are located in North America, ranked according to their latitude. When a geomagnetic disturbance starts the most northern magnetometers will respond and as the disturbance strengthens the lower magnetometers will respond as well.
Data from the U.S. Geological Survey. Stackplot by the Tromsø Geophysical Observatory.
| Code | Imię | Położenie | Geographic latitude | Geographic longitude |
|---|---|---|---|---|
| DED | Deadhorse | Alaska, United States | 70.35N | 148.79W |
| BRW | Barrow | Alaska, United States | 71.32N | 156.62W |
| CMO | College, Fairbanks | Alaska, United States | 64.87N | 147.85W |
| SIT | Sitka | Alaska, United States | 57.05N | 135.32W |
| NEW | Newport, Colville National Forest | Washington, United States | 48.26N | 117.12W |
| KGI | King George Island | King Sejong Station, Antarctica | 62.13S | 58.46W |
| SHU | Shumagin, Sand Point (Popof) | Alaska, United States | 55.34N | 160.46W |
| BOU | Boulder | Colorado, United States | 40.13N | 105.23W |
| FRD | Fredericksburg, Corbin | Virginia, United States | 38.20N | 77.37W |
| BSL | Stennis Space Center | Mississippi, United States | 30.35N | 89.63W |
| FRN | Fresno, O'Neals | California, United States | 37.09N | 119.71W |
| TUC | Tucson | Arizona, United States | 32.17N | 110.73W |
| SJG | San Juan | Cayey, Puerto Rico | 18.11N | 66.14W |
| HON | Honolulu, Ewa Beach | Hawaii, United States | 21.31N | 157.99W |
| GUA | Guam, Dededo | Western Pacific Ocean | 13.58N | 144.86E |
Hobart (Australia)
This magnetogram gives you the values measured by the ground station of Hobart (Australia, Tasmania). If you are not located in Australia or New Zealand, please consult a magnetometer near your location for a more accurate representation of the current geomagnetic activity. Additional southern hemisphere magnetometer and K-index plots can be found under the dropdown buttons.
Credit: Geoscience Australia, University of Newcastle Space Physics Group, Australian Government Antarctic Division and International Center for Space Weather Science and Education, Japan.
GOES
This plot shows the 1-minute averaged parallel component of the magnetic field in nanoTeslas, measured by the primary GOES satellite. A daily variation is observed in these data because at geosynchronous orbit, the magnetic field is stronger on the dayside of Earth and weaker on the nightside. If the data drops below zero when the satellite is on the dayside, it may be due to a compression of the Earth's magnetopause into the geosynchronous orbit boundaries. On the nightside, the smaller field values indicate strong currents in the magnetotail that are often associated with the stretching and subsequent release of energy in Earths tail which result in aurora on Earth.
Więcej magnetometrów
- Lycksele Magnetometer
- SAM Europe online Magnetometer
- AuroraWatch UK
- Leirvogur Magnetic Observatory, Iceland
- Boulder Magnetometer
Najnowsze wiadomości

Lot's of sunspots! Big chance for major flare activity?

X1.1 solar flare with earth-directed CME

Sunspot region 3615, G1 watch
Najnowsze wiadomości z forum
Wesprzyj SpaceWeatherLive.com!
Wielu ludzi odwiedza SpaceWeatherLive aby śledzić aktywność słoneczną lub sprawdzić czy jest szansa na zaobserwowanie zorzy polarnej. Niestety, większy ruch na stronie oznacza większe koszty utrzymania serwera. Dlatego, jeśli jesteś zadowolony ze strony SpaceWeatherLive, zachęcamy do wspierania nas finansowo. Dzięki temu będziemy mogli utrzymać naszą stronę.

Fakty na temat pogody kosmicznej
| Ostatnie rozbłyski klasy X | 2024/03/28 | X1.1 |
| Ostatnie rozbłyski klasy M | 2024/04/25 | M1.3 |
| Ostatnia burza geomagnetyczna | 2024/04/26 | Kp5+ (G1) |
| Spotless days | |
|---|---|
| Ostatni dzień bez skazy | 2022/06/08 |
| Monthly mean Sunspot Number | |
|---|---|
| marca 2024 | 104.9 -19.8 |
| Last 30 days | 136.8 +28.6 |