M1.9 solar flare from sunspot region 2339, incoming CME?
Tuesday, 5 May 2015 10:59 UTC
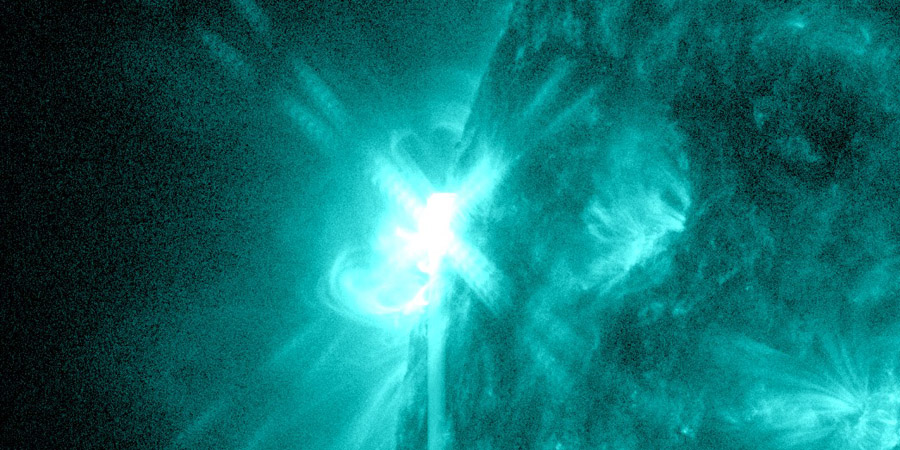
Old sunspot region 2322 which has received new sunspot number 2339 is now rotating back onto the earth-facing disk and it is still active. This sunspot region which was likely the source of numerous coronal mass ejections while on the farside of the Sun produced an M1.9 solar flare that peaked at 09:47 UTC.
The solar flare did not look eruptive and it likely launched no coronal mass ejection. A quick look at sunspot region 2339 shows lot's of faculae indicating this sunspot region could be in decay. We will get a better look at this sunpot region in the next 24 to 48 hours. This will give us a better picture so we can indicate if this region really is in decay and how complex it's magnetic layout is.
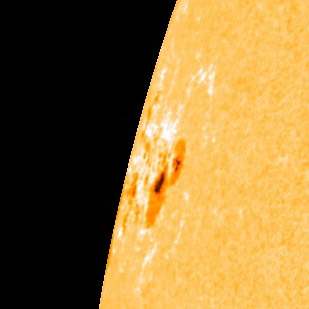
Image: Sunspot region 2339 (ex-2332) as seen in visible light by NASA SDO.
A honourable mention goes to sunspot region 2335 which is in an earth-facing position right now. This sunspot region has been growing slowly and now has one magnetic delta structure and one delta structure candidate. It has yet to produce an M-class solar flare but it could very well do so in the coming days. It is complex enough for a low-level M-class solar flare. Keep an eye on this sunspot region as well as an eruption from this sunspot region has a good chance of coming towards our planet.
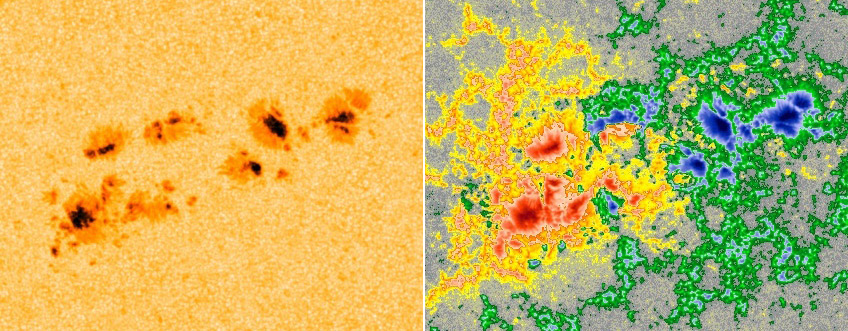
Images: Sunspot region 2335 as seen by NASA SDO. Visible light (left) and magnetogram (right).
Incoming coronal mass ejection?
A weak coronal mass ejection from a filament eruption that occured a few days ago could arrive in the coming 12 to 36 hours. The low energy protons and electrons as measured by ACE EPAM are rising indicating an approaching plasma cloud. The coronal mass ejection is heading mostly south of Earth as seen on SOHO coronagraph imagery but a weak glancing blow can not be excluded. Geomagnetic storming is not expected. Below a still of NOAA's ENLIL model showing the incoming CME.
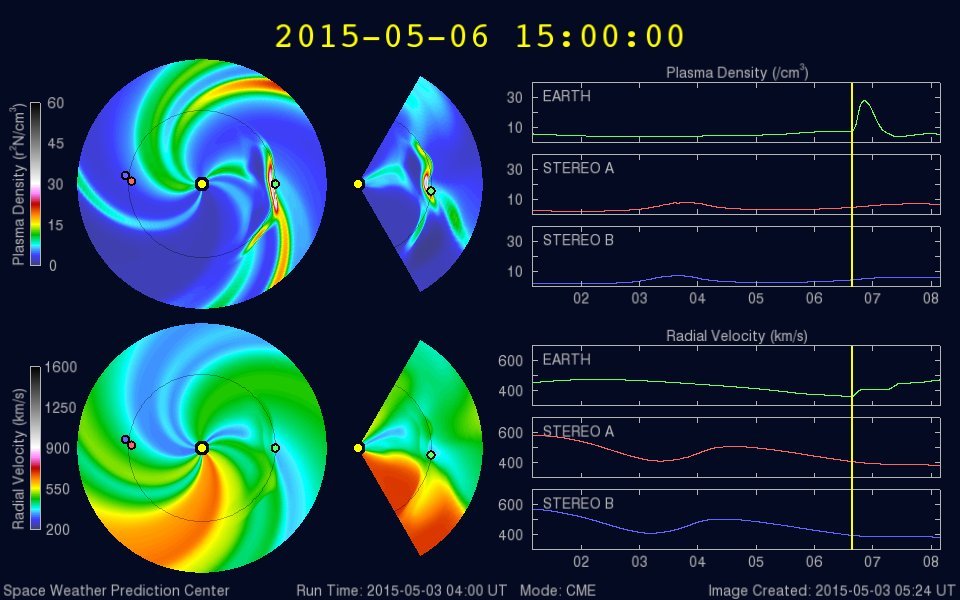
Image: NOAA's ENLIL model showing a possible glancing blow CME passage.
Thank you for reading this article! Did you have any trouble with the technical terms used in this article? Our help section is the place to be where you can find in-depth articles, a FAQ and a list with common abbreviations. Still puzzled? Just post on our forum where we will help you the best we can!
Latest news

Lot's of sunspots! Big chance for major flare activity?

X1.1 solar flare with earth-directed CME

Sunspot region 3615, G1 watch
Latest forum messages
Support SpaceWeatherLive.com!
A lot of people come to SpaceWeatherLive to follow the Sun's activity or if there is aurora to be seen, but with more traffic comes higher server costs. Consider a donation if you enjoy SpaceWeatherLive so we can keep the website online!

Space weather facts
| Last X-flare | 2024/03/28 | X1.1 |
| Last M-flare | 2024/04/25 | M1.3 |
| Last geomagnetic storm | 2024/04/19 | Kp7 (G3) |
| Spotless days | |
|---|---|
| Last spotless day | 2022/06/08 |
| Monthly mean Sunspot Number | |
|---|---|
| March 2024 | 104.9 -19.8 |
| Last 30 days | 135.5 +27.6 |