Visualizzazione archivio di lunedì, 30 gennaio AM
Rapporto attività solare
Ogni brillamento solare menzionato nel rapporto ha un fattore di scala, applicato dal Centro di Predizione Meteorologica Spaziale (SWPC). A causa del fattore di scala del SWPC, i brillamenti solari sono segnalati come ridotti del 42%, rispetto ai dati di qualità scientifica. Il fattore di scala è stato rimosso dai nostri dati archiviati sui brillamenti solari, per riflettere le unità fisiche reali.
Rapporto dell'Attività Geofisica Solare 2012 Jan 30 2200 UTCPreparati dal SWPC della NOAA© ed elaborati da SpaceWeatherLive.com
Rapporto Congiunto USAF/NOAA dell'Attività Solare e Geofisica
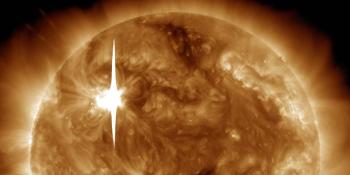
SDF Numero 030 Emesso alle 2200Z il Jan 30 2012IA. Analisi delle Regioni Solari Attive e Attività dalle 2100Z-29 alle 2100Z-30 Solar activity was low. Region 1410 (N24E16) produced a
single C-class x-ray event during the period.
IB. Previsione dell'Attività Solare
Solar activity is expected to be very
low to low over the next 3 days (31 January - 02 February).
IIA. Sommario dell'Attività Geofisica dalle 2100Z-29 alle 2100Z-30
The geomagnetic field was quiet, until the arrival of a glancing blow
from the limb event CME that occurred in association with the X1/1f
flare on 27 January. The transient passage was observed by the ACE
spacecraft at 30/1554Z with a solar wind speed increase from around
350 km/s to near 450 km/s. A weak sudden impulse measuring 8nT was
observed by the Boulder magnetometer at 30/1635Z. Conditions
afterwards ranged from unsettled to quiet. The greater than 10 MeV
proton that began at 27/1905Z and reached a maximum of 796 pfu at
28/0205Z was still in progress at the time of this event, with flux
levels hovering near 20 pfu. The greater than 2 MeV electron flux at
geosynchronous orbit reached high levels during the period.
IIB. Previsione dell'Attività Geofisica
The geomagnetic field is
expected to be mostly quiet for days 1-3 (31 January - 02 February).
The greater than 10 MeV proton flux levels, as observed by NOAA
GOES-13 in geosynchronous orbit, are expected to decay below the 10
pfu threshold in the next day or two.
III. Probabilità dell'Evento dalle Jan del 31 alle Feb del 02
| Classe M | 01% | 01% | 01% |
| Classe X | 01% | 01% | 01% |
| Protone | 99% | 50% | 01% |
| PCAF | yellow | ||
IV. Flusso di 10.7 cm di Penticton
  Osservato       30 Jan 114
  Previsto   31 Jan-02 Feb  115/115/115
  Media di 90 Giorni        30 Jan 143
V. Indici Geomagnetici A
  Osservato Afr/Ap 29 Jan  005/006
  Stimato     Afr/Ap 30 Jan  000/005
  Previsto    Afr/Ap 31 Jan-02 Feb  004/005-004/005-005/005
VI. Probabilità dell'Attività Geomagnetica dal 31 Jan al 02 Feb
| A. Latitudini Medie | |||
|---|---|---|---|
| Attivo | 05% | 05% | 05% |
| Tempesta minore | 01% | 01% | 01% |
| Tempesta maggiore-grave | 01% | 01% | 01% |
| B. Latitudini Alte | |||
|---|---|---|---|
| Attivo | 05% | 05% | 05% |
| Tempesta minore | 01% | 01% | 01% |
| Tempesta maggiore-grave | 01% | 01% | 01% |
<< Vai alla pagina della panoramica giornaliera
Ultime notizie

sabato, 23 marzo PM
X1.1 solar flare with earth-directed CME

mercoledì, 20 marzo PM
Sunspot region 3615, G1 watch
giovedì, 22 febbraio PM
X6.3 solar flare
Ultimi messaggi dal forum
Unspecified geomagnetic activity 904Growth of Cycle 25 417GONG Farside Images added to the SWL site? 3Changelog/Featurelog 152Imagery from Total Solar Eclipse 08/04/2024 5
Altri argomentiSupporta SpaceWeatherLive.com!
Molte persone vengono su SpaceWeatherLive per seguire l'attività del Sole o sapere se ci sia la possibilità di vedere l'aurora, ma a maggior traffico corrispondono costi maggiori. Considerate una donazione se vi piace SpaceWeatherLive così che possiamo mantenere online il sito web!

Notizie sul meteo spaziale
| Ultimo brillamento X | 2024/03/28 | X1.1 |
| Ultimo brillamento M | 2024/04/19 | M1.0 |
| Ultima tempesta geomagnetica | 2024/04/16 | Kp5 (G1) |
| Giorni senza macchie | |
|---|---|
| Ultimo giorno senza macchie | 2022/06/08 |
| Media mensile Numero di Macchie Solari | |
|---|---|
| marzo 2024 | 104.9 -19.8 |