M9.2 coronal mass ejection analysis
Sunday, 8 March 2015 12:47 UTC
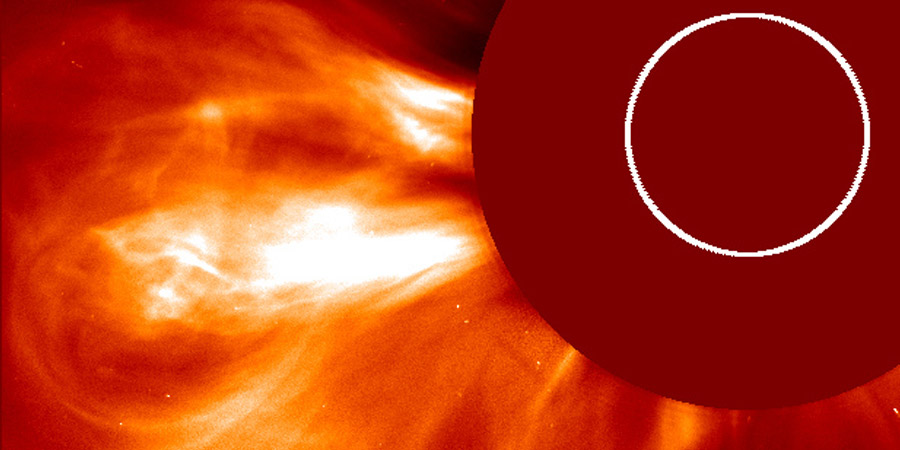
SOHO coronagraph imagery is now complete giving us the chance to analyse the trajectory of the coronal mass ejection that was launched by yesterday's M9.2 solar flare that peaked at 22:22 UTC.
As expected, the coronal mass ejection is heading well east and away from Earth. The formation of almost a full halo signature can be seen several hours after the eruption as seen in the SOHO C3 coronagraph but the westward flank of the coronal mass ejection is poorly defined. There has also not been any increase in the low/high energy protons or electrons following the eruption. If we take all this into account plus the location of the blast near the east-limb we can only conclude that a minor shock passage is possible at best on 10 March, 2015 but the geomagnetic consequences should be minimal.
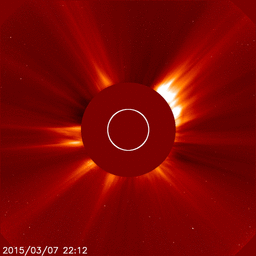
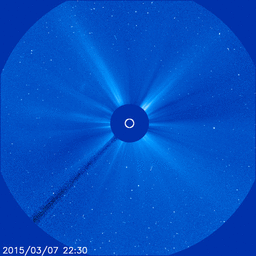
Animations: SOHO coronagraph imagery showing the coronal mass ejection from the M9.2 solar flare.
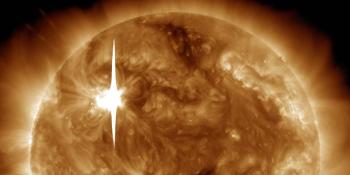
Sunspot region 2297
Despite the large solar flares that it produced since rotating into view, sunspot region 2297 is a fairly normal active region with a clear beta-gamma magnetic layout without any delta structures that could give this sunspot region more power for strong flares. It is actually surprising that it manged to produce such a strong solar flare. Compared to yesterday the sunspot region lost some penumbral area but gained some spots near the northern trailing sunspot. An isolated low-level M-class solar flare can not be excluded but the chance for another large solar flare like yesterday's M9 solar flare is low.
M-class flare probability for the coming 24 hours: 30% chance
X-class flare probability for the coming 24 hours: 5% chance
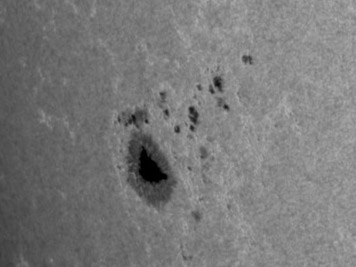
Image: Sunspot region 2297 as seen by NASA SDO.
Sunspot region 2297 is now the only numbered sunspot region on the earth-facing solar disk. Solar activity will be low with a slight chance for moderate to high activity.
Thank you for reading this article! Did you have any trouble with the technical terms used in this article? Our help section is the place to be where you can find in-depth articles, a FAQ and a list with common abbreviations. Still puzzled? Just post on our forum where we will help you the best we can!
Latest news

X1.1 solar flare with earth-directed CME

Sunspot region 3615, G1 watch
X6.3 solar flare
Latest forum messages
Support SpaceWeatherLive.com!
A lot of people come to SpaceWeatherLive to follow the Sun's activity or if there is aurora to be seen, but with more traffic comes higher server costs. Consider a donation if you enjoy SpaceWeatherLive so we can keep the website online!

Space weather facts
| Last X-flare | 2024/03/28 | X1.1 |
| Last M-flare | 2024/04/18 | M1.5 |
| Last geomagnetic storm | 2024/04/16 | Kp5 (G1) |
| Spotless days | |
|---|---|
| Last spotless day | 2022/06/08 |
| Monthly mean Sunspot Number | |
|---|---|
| March 2024 | 104.9 -19.8 |