M9.2 solar flare from sunspot region 2297
Saturday, 7 March 2015 23:20 UTC
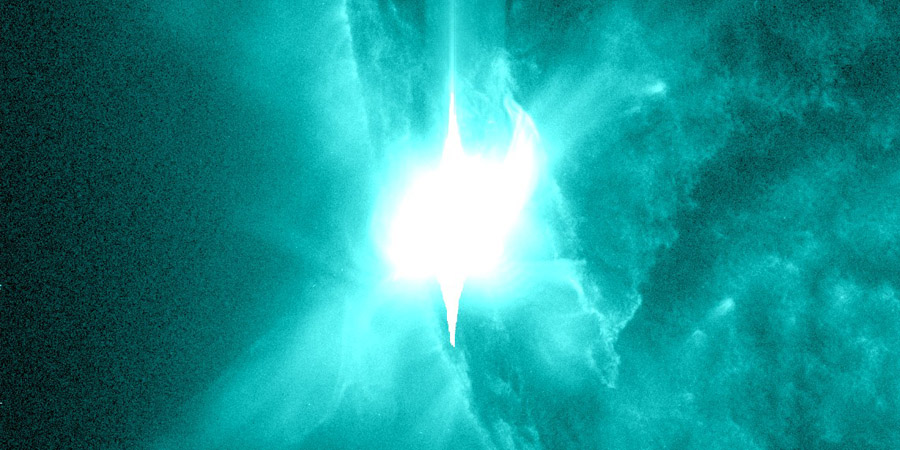
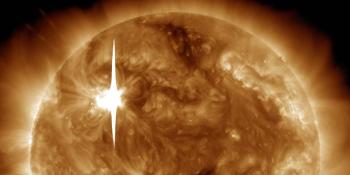
Sunspot region 2297 is active again after a relative calm past 36 hours. It produced the strongest solar flare thus far in 2015: a near X-class event that peaked at M9.2 (R2-moderate) around 22:22 UTC. This was a long duration event which means it likely produced a coronal mass ejection. When looking at difference imagery from SDO we can conclude that a massive coronal mass ejection was launched, something the latest LASCO coronagraph imagery confirms.
Strong M9.28 solar #flare from #sunspot region 12297 - Follow live on http://t.co/XHATH0OOfT pic.twitter.com/An7lguk2bd
— SpaceWeatherLive (@_SpaceWeather_) 7 maart 2015
Image: Difference imagery from NASA SDO showing coronal dimming, a sign that a coronal mass ejection was launched.
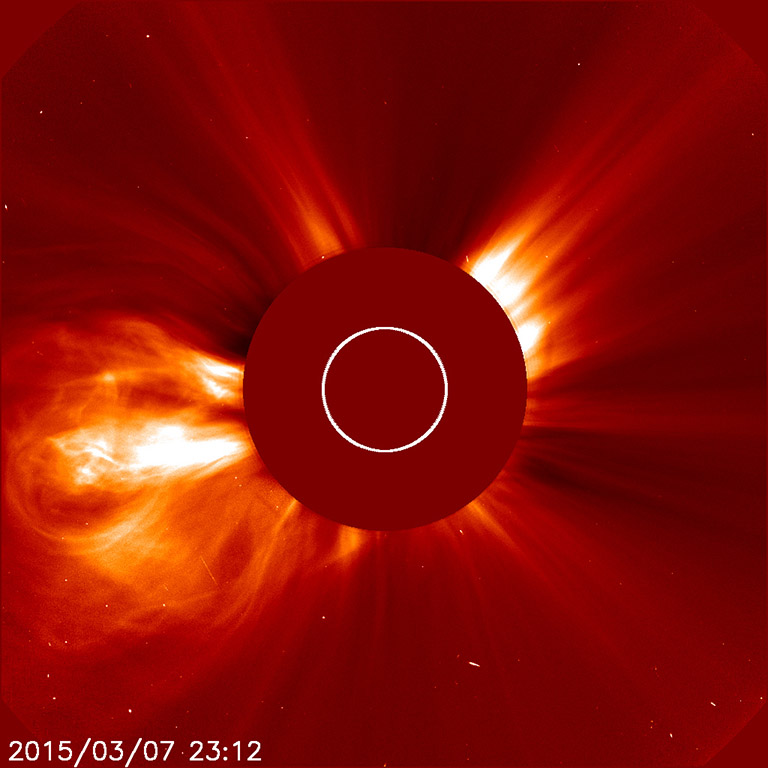
Image: Latest SOHO/LASCO C2 image showing a bright coronal mass ejection leaving the blast site.
A solar radiation storm is not expected as this sunspot region is not located in a prime position to cause such an event and this coronal mass ejection will also certainly not come directly towards Earth. We will have to wait for more coronagraph imagery before we can make a definitive conclusion regarding the exact trajectory of this CME. A glancing blow could be expected at most but it is also possible that the plasma cloud will miss Earth completly.
NOAA SWPC alerts
ALERT: X-Ray Flux exceeded M5
Threshold Reached: 2015 Mar 07 2203 UTC
NOAA Scale: R2 - Moderate
ALERT: Type II Radio Emission
Begin Time: 2015 Mar 07 2157 UTC
Estimated Velocity: 704 km/s
ALERT: Type IV Radio Emission
Begin Time: 2015 Mar 07 2204 UTC
SUMMARY: 10cm Radio Burst
Begin Time: 2015 Mar 07 2236 UTC
Maximum Time: 2015 Mar 07 2239 UTC
End Time: 2015 Mar 07 2246 UTC
Duration: 10 minutes
Peak Flux: 260 sfu
Latest Penticton Noon Flux: 138 sfu
SUMMARY: X-ray Event exceeded M5
Begin Time: 2015 Mar 07 2145 UTC
Maximum Time: 2015 Mar 07 2222 UTC
End Time: 2015 Mar 07 2258 UTC
X-ray Class: M9.2
Location: S19E60
NOAA Scale: R2 - Moderate
We will provide more news regarding this solar flare and it's coronal mass ejection tomorrow as more coronagraph imagery becomes available. Keep an eye on this website!
Thank you for reading this article! Did you have any trouble with the technical terms used in this article? Our help section is the place to be where you can find in-depth articles, a FAQ and a list with common abbreviations. Still puzzled? Just post on our forum where we will help you the best we can!
Latest news

X1.1 solar flare with earth-directed CME

Sunspot region 3615, G1 watch
X6.3 solar flare
Latest forum messages
Support SpaceWeatherLive.com!
A lot of people come to SpaceWeatherLive to follow the Sun's activity or if there is aurora to be seen, but with more traffic comes higher server costs. Consider a donation if you enjoy SpaceWeatherLive so we can keep the website online!

Space weather facts
| Last X-flare | 2024/03/28 | X1.1 |
| Last M-flare | 2024/04/19 | M1.0 |
| Last geomagnetic storm | 2024/04/16 | Kp5 (G1) |
| Spotless days | |
|---|---|
| Last spotless day | 2022/06/08 |
| Monthly mean Sunspot Number | |
|---|---|
| March 2024 | 104.9 -19.8 |