M-class solar flare, elevated EPAM levels
Monday, 1 December 2014 17:31 UTC
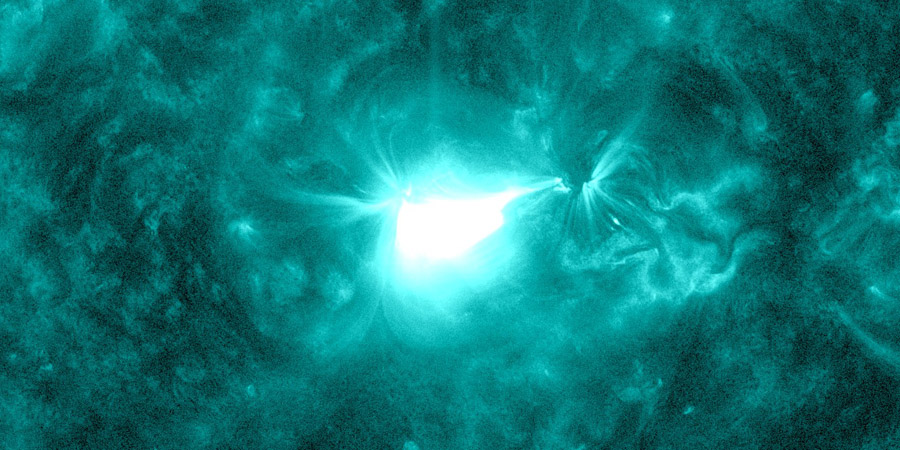
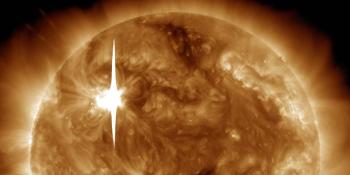
Solar activity reached moderate levels today for the first time since 16 November 2014, all thanks to an M1.8 solar flare at 06:41 UTC from sunspot region 2222. We also see enhanced proton and electron levels as measured by ACE EPAM. In this article we will try to find out what is causing this. Could there be a coronal mass ejection heading towards Earth or is there one arriving right now?
M1.8 solar flare
Solar activity reached moderate levels today for the first time since 16 November 2014, all thanks to an M1.8 solar flare at 06:41 UTC from sunspot region 2222. The solar flare was relatively impulsive and no coronal mass ejection was released.
Moderately strong M1.83 solar #flare - Follow live on http://t.co/8JIfkaXUPc pic.twitter.com/pIqeVhPWC7
— SpaceWeatherLive (@_SpaceWeather_) 1 december 2014
SUMMARY: 10cm Radio Burst
Begin Time: 2014 Dec 01 0630 UTC
Maximum Time: 2014 Dec 01 0633 UTC
End Time: 2014 Dec 01 0636 UTC
Duration: 6 minutes
Peak Flux: 180 sfu
Latest Penticton Noon Flux: 177 sfu
Source of this solar flare was sunspot region 2222, a modest sunspot region both in size and complexity near the center of the earth-facing solar disk. It has a Beta-Gamma magnetic layout but there is not a whole lot of magnetic mixing. Chanches are that this sunspot region turns out to be a one trick pony, further moderate solar activity is unlikely. This sunspot region does not have any delta sunspots.
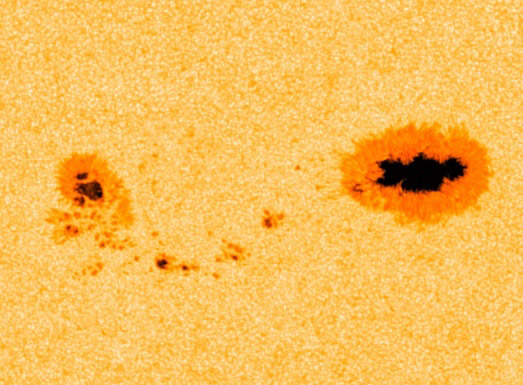
All the other sunspot regions on the disk are unremarkable and unlikely to produce strong solar flares. Only sunspot region 2217 might be worth keeping an eye on as it does show signs that it is developing a moderately complex magnetic layout but it remains a fairly small sunspot region. Solar activity will likely be low (C-class) in the next 24 hours.
M-class flare probability for the coming 24 hours: 20% chance
X-class flare probability for the coming 24 hours: 1% chance
Elevated EPAM levels
Alert visitors of our website might have noticed that the protons and electrons as measured by ACE EPAM were on the rise. This could indicate that a coronal mass ejection might be heading towards Earth. This is not something that we have been writing about the past few days so what is going on? Below the ACE EPAM plot as it was at 17:00 UTC on 1 December.
A clear rising trend can be seen on the graph with a peak around 15 UTC. Solar wind and IMF values have been slowly rising since the EPAM peak and the IMF Bt is now close to 15nT which might mean that we are seeing a glancing blow coronal mass ejection passage right now.
Let's take a look at LASCO coronagraph imagery to see if we can find a good candidate. Our eyes immediately fall on a series of complex events that occured on the 28 and 29 of November which came from two filament eruptions. One west of the central meridian (on 28 November) and one near the NE limb on the 29th. An animation of these LASCO frames can be found below.
Both coronal mass ejection were slow but they are the best candidates that we could find from the past few days which could have an earth-directed component. No halo signatures were seen in these coronal mass ejections but the second coronal mass ejection (heading mostly east) is slightly wider than the first one. We would normaly not say that this coronal mass ejection has an earth-directed component but it is the best explanation that we could find for the rising trend on EPAM and the now elevated IMF values. We rule out coronal hole effects as there have not been any coronal holes in geo-effective position.
Be alert in the next 24 hours as extended periods of southward directed IMF could spark aurora at high latitudes. Geomagnetic storming is not to be expected.
Thank you for reading this article! Did you have any trouble with the technical terms used in this article? Our help section is the place to be where you can find in-depth articles, a FAQ and a list with common abbreviations. Still puzzled? Just post on our forum where we will help you the best we can!
Latest news

X1.1 solar flare with earth-directed CME

Sunspot region 3615, G1 watch
X6.3 solar flare
Latest forum messages
Support SpaceWeatherLive.com!
A lot of people come to SpaceWeatherLive to follow the Sun's activity or if there is aurora to be seen, but with more traffic comes higher server costs. Consider a donation if you enjoy SpaceWeatherLive so we can keep the website online!

Space weather facts
| Last X-flare | 2024/03/28 | X1.1 |
| Last M-flare | 2024/04/17 | M1.6 |
| Last geomagnetic storm | 2024/04/16 | Kp5 (G1) |
| Spotless days | |
|---|---|
| Last spotless day | 2022/06/08 |
| Monthly mean Sunspot Number | |
|---|---|
| March 2024 | 104.9 -19.8 |