An Expansion on Solar Cycle Prediction
Wednesday, 8 February 2023 17:58 UTC
Today we have a really special news item for you! We have a guest post made by Christian Harris from Space Weather Trackers. Christian is a friend of the website an has made very well received guest posts before. He has some serious big brain knowledge about everything space weather related. I am sure many of you have heard of him before. He is here to shed some light on the progression of Solar Cycle 25. Please read his article below and gain some fascinating insights on how SC25 is developing. It is well worth the read! If you are interested in Christian's work be sure to follow him on Facebook and follow his Space Weather Trackers Facebook page. Christian, the stage is yours:
An Expansion on Solar Cycle Prediction: An Update and the Hale Cycle Termination
When I wrote about the progress of Solar Cycle 25 (SC25) in April of last year, we were beginning to see a continuous exceeding of the estimated values expected by the forecast set by NOAA back in 2019. Sunspot numbers were, in some cases, doubling their forecasted averaged monthly values; M, and X class flares were occurring frequently; and Coronal Mass Ejections (CMEs) could be seen leaving the solar corona in imagery daily. I also brought up a work by McIntosh et al. (2020) forecasting the peak amplitude of SC25 that wildly differed from the initial NOAA forecast, pointing toward a much stronger forecast than the previous cycle, and how it seemed to be fitting the current trend in data much more appropriately. Today I look to expand on that work as well as check the progress from the last article.
SC25 officially began as of December 2019, and was given a forecasted maximum sunspot number (SSN) of 115, predicted to take place around July 2025, as stated by NOAA. As the months passed, sunspot numbers quickly began to exceed the forecast for any given month in the middle of 2020, which then accelerated further in the beginning of 2021. As of March 2021, the sunspot number was regularly well above the forecasted amount, leading to a smoothed average over double what was predicted. Arrive at January 2023, NOAA had a forecasted average value of 63.4, whereas the measured value landed on 143.6!
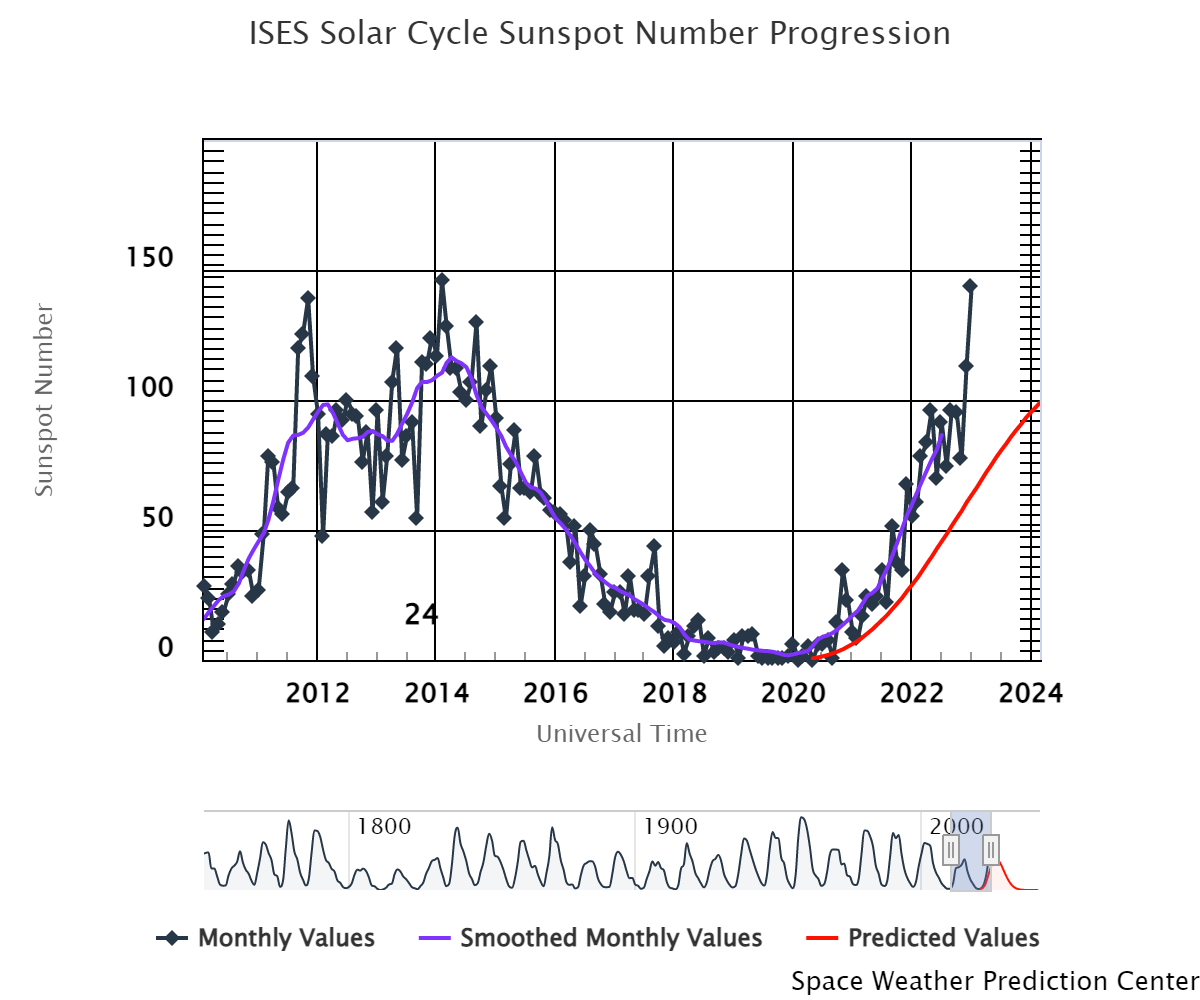
As a comparison, this number is slightly higher than the first monthly average peak in SC24, and just barely under the second peak. More impressively in the numbers for January is the second index that is observed during the solar cycle, the Solar Flux Index, also denoted as the f10.7.
The Solar Flux Index (SFI) is a number that looks at how much light the sun emits specifically at a wavelength of 10.7cm, which translates to a radio frequency of 2800 megahertz, just within the Ultra High Frequency bands. This index generally increases and decreases with sunspot number, but also increases as sunspot complexity increases, which leads to higher numbers during sunspot maximum. When January numbers were posted, the average SFI for January came out to 182.5, with several individual days sitting above 200!
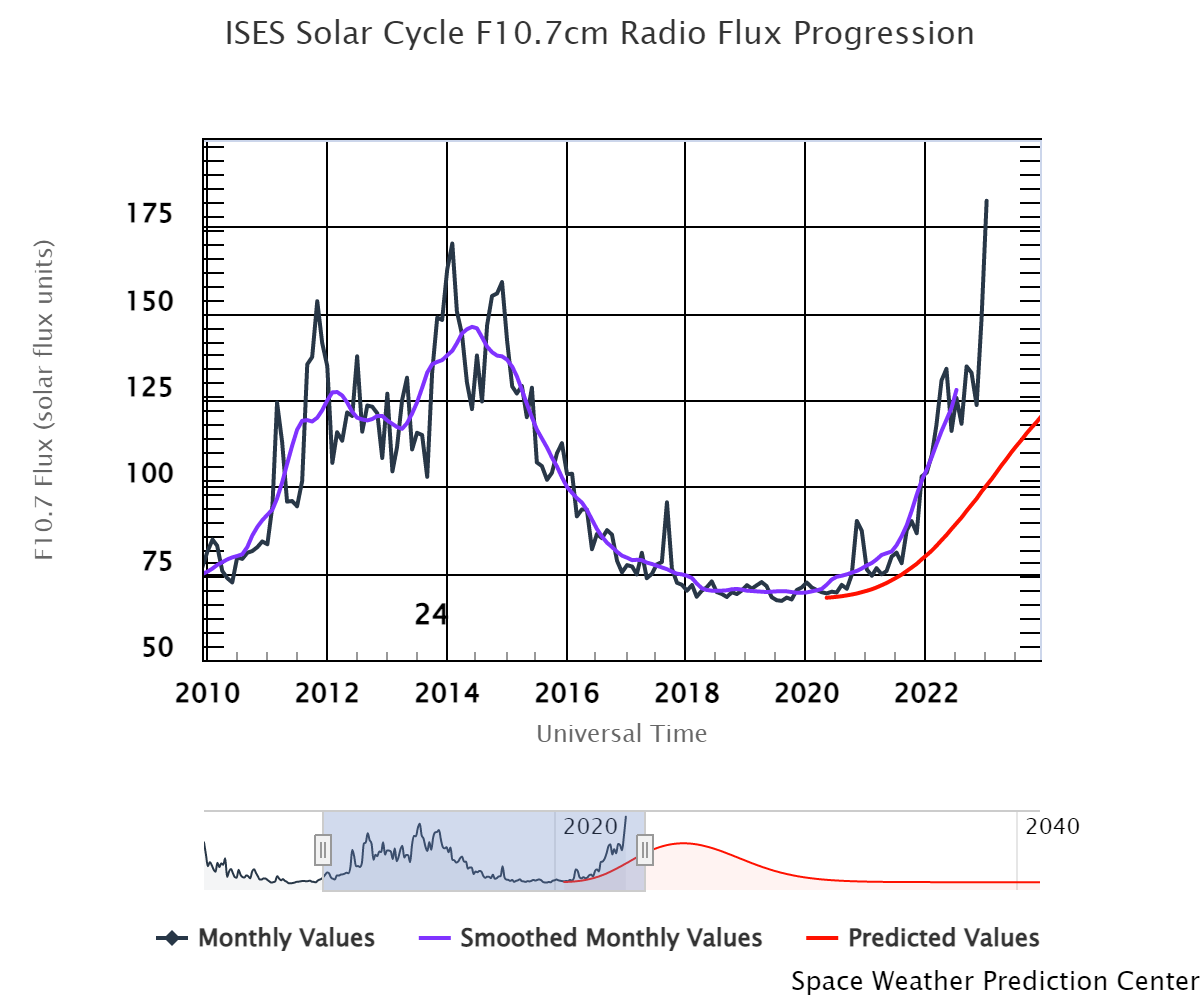
These numbers are quite a bit higher than anything SC24 saw during its time and show a very sharp deviation even from the averaged numbers in SC25 thus far. This number can be attributed to the numerous amounts of sunspot regions present during January that also showed moderate-to-high level complexity in their forms. It’s clear the forecast set by NOAA back in 2019 will likely fall significantly short of the actual cycle strength we will see come solar maximum. How has McIntosh and his team’s forecast gone so far in comparison using the Hale Cycle Termination work?
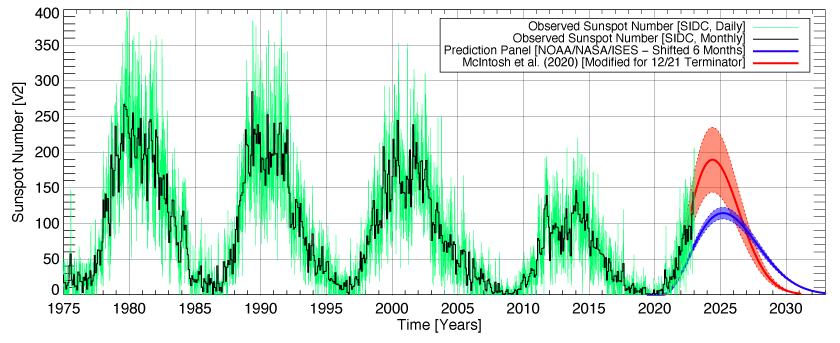
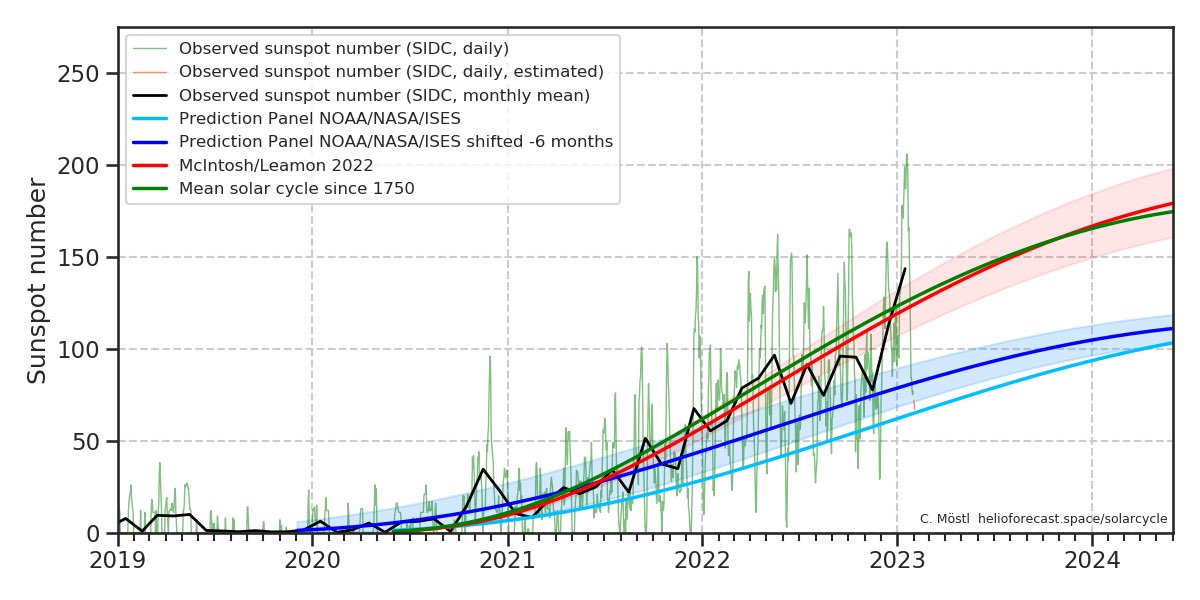
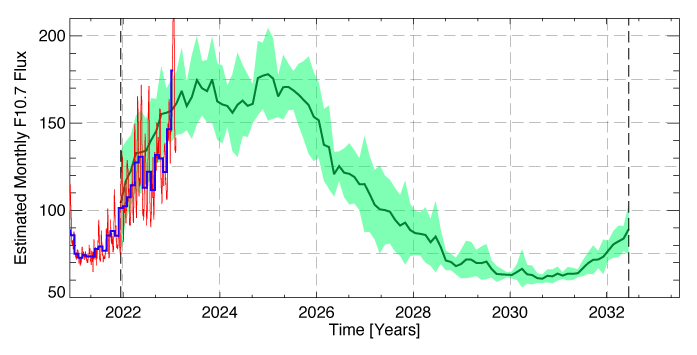
The estimated maximum SSN ultimately finalized at a value of 184 with 95% confidence that the true value will lie between 121 and 247. Even the lower end of this estimate lies near the very top of the forecast set by NOAA. The chart below shows SSN values over time, with several of the forecasts and measured values superimposed on top. The measured daily values, and those values averaged month to month, are the thin green and bold black lines, respectively. These are then compared to the NOAA forecast with solar maximum 6 months early (blue line), and the McIntosh forecast (red line). When looking at this chart, the vast differences in recorded values and NOAA estimates are apparent, but what is more interesting is the much closer agreement to the McIntosh forecast. Similarly, the second photo below shows the current and forecasted solar flux values using the Hale Cycle Termination work. Since it’s clear there is better agreement between the two, we can dig a little deeper about what is new about this forecast.
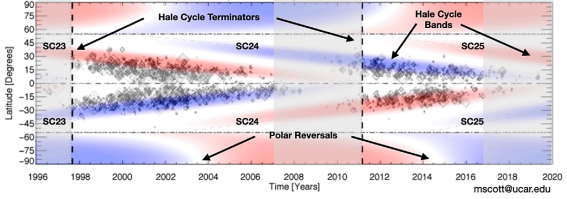
In 2014, McIntosh’s team was studying coronal Bright Points (BPs)—small, bright areas in the sun’s corona that have an association with the solar cycle in which they arrive moving from mid-latitudes to the equator—and noticed a very well-defined time period, (sometimes taking less than a full solar rotation) where the BPs of the previous cycle completely disappeared at the equator at the same time an increase in sunspot growth and frequency at mid-latitudes of the current cycle began. This time was specified as the “termination event” and was described as the full cancellation of the previous cycle’s Hale Cycle bands (the toroidal magnetic component). This event was also associated with an increase in strength in the current cycle’s toroidal field as it began to descend to the equator, eventually leading to solar maximum. The chart below, from their most recent paper, shows the progress of the Hale Cycle bands from their appearance at mid-latitudes, to the equator.
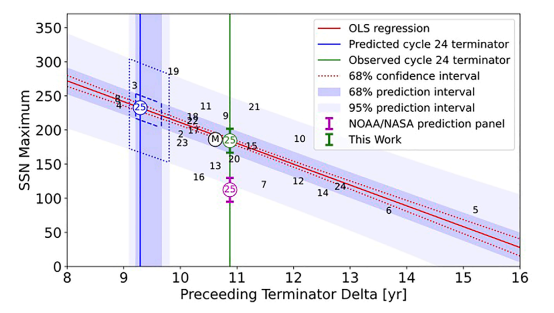
The discovery that came out of this, after inputting the data into a Hilbert Transform, showed a strong relationship between the time elapsed from one termination event to the next and the subsequent maximum sunspot number for the current cycle. At the time this work was being done, the termination event of cycle 24 had not yet been seen, but ultimately was detected as of December 2021. Using the data from previous calculations, the chart below was created to show the maximum SSN as a function of the time in years between termination events. Having previously calculated the termination event of cycle 23 to fall in the second quarter of 2011, they then arrived at the given forecast of 184 +/- 63 with an estimated date between the last quarter of this year and the last quarter of 2024.
Last I wrote about this work, the viewpoint was more hopeful than data-driven given how early into the cycle it was. The two photos below show, in more detail, the current and forecasted SSN and SFI values for this cycle. Considering the tight agreement in data and forecast and given the strong deviation from NOAA estimations, the picture becomes clearer that using the Hale Cycle Terminations to forecast solar cycles isn’t simply guesswork or lucky statistics but has a real connection to the solar dynamo and allows us to make far more accurate predictions for future cycles.
Since we’re not quite to solar maximum yet, it is be expected that we will continue to see an increase in amount and complexity of sunspot regions, the risk of longer radio blackouts, as well as radiation and geomagnetic storming. Could we see our first maximum-level geomagnetic storm, or record-breaking X-class flare before the end of this cycle? As always, our eyes are to the skies.
Thank you for reading this article! Did you have any trouble with the technical terms used in this article? Our help section is the place to be where you can find in-depth articles, a FAQ and a list with common abbreviations. Still puzzled? Just post on our forum where we will help you the best we can!
Latest news

Lot's of sunspots! Big chance for major flare activity?

X1.1 solar flare with earth-directed CME

Sunspot region 3615, G1 watch
Latest forum messages
Support SpaceWeatherLive.com!
A lot of people come to SpaceWeatherLive to follow the Sun's activity or if there is aurora to be seen, but with more traffic comes higher server costs. Consider a donation if you enjoy SpaceWeatherLive so we can keep the website online!

Space weather facts
| Last X-flare | 2024/03/28 | X1.1 |
| Last M-flare | 2024/04/25 | M1.3 |
| Last geomagnetic storm | 2024/04/19 | Kp7 (G3) |
| Spotless days | |
|---|---|
| Last spotless day | 2022/06/08 |
| Monthly mean Sunspot Number | |
|---|---|
| March 2024 | 104.9 -19.8 |
| Last 30 days | 133.4 +25.6 |