New front page!
Thursday, 5 April 2018 15:40 UTC
After literally months of planning, brain storming, coding, translating and fighting over the tiniest details, we are very proud to present to you a brand new front page for SpaceWeatherLive.com and our Dutch website Poollicht.be!
On this new front page we tried to keep the best parts of our old front page and expanded on it with more information and new features. The general style of the page remains the same but the layout is different with a much cleaner, more condensed look. Below we will highlight a few of the most important changes that you need to know about:
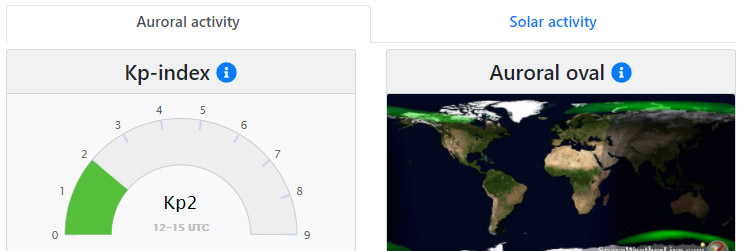
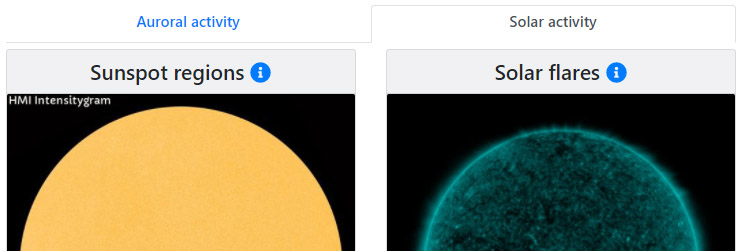
Auroral activity and solar activity tabs
This is arguably the most noteworthy change. On the old front page, the auroral activity section and solar activity section were smashed on the same page. Auroral activity came first and if you scrolled down you found the solar activity section. This is now radically different. You can now switch between the auroral activity page and solar activity page with a simple mouse click on one of the tabs on top of the page. Easy, clean and an effective way to quickly access the information you are looking for.
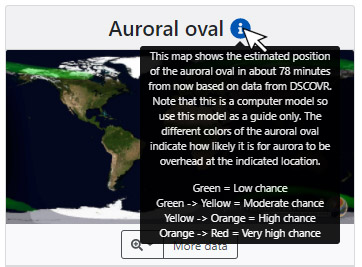
Explaining texts behind mouse overs
On the old front page, every item came accompanied by a title and a little explaining text usually a few sentences long. Very handy for visitors new to the website or new to space weather, to understand what they are looking at. However, these texts are something you've probably never bothered reading again after your first visit.
Nonetheless, These texts are important to have and they of course must remain present on the site. In fact, we overhauled many of these texts by adding information or improving them. The change here is that they are now hidden from view so they don't take up any valuable real estate. You will now find these text under mouse overs. All you do is hover your mouse or click on the blue ''I'' (information) icon or in some cases an info button. A box will appear with the appropriate text. A solution which gives the front page a very clean look we think and avoids excessive scrolling.
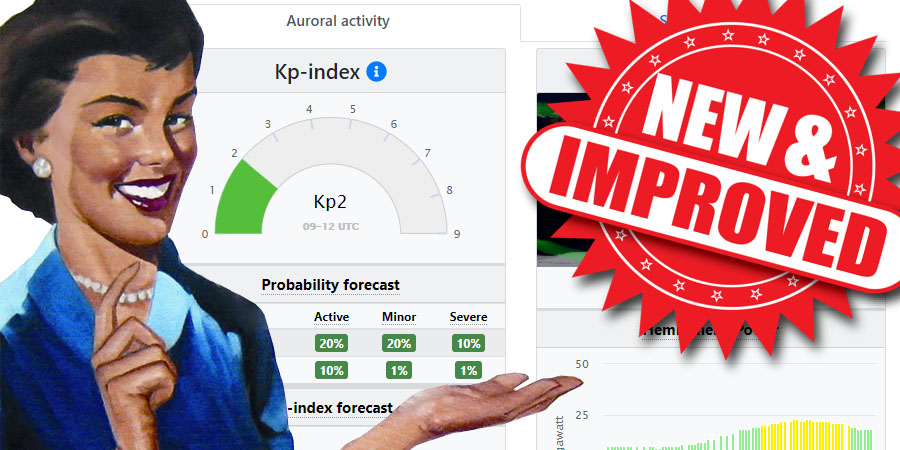
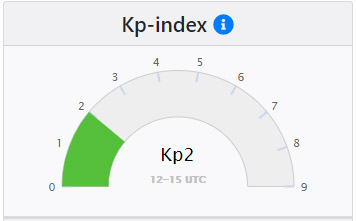
Kp-index gauge
Hooray something new! We are happy to introduce to you a new gauge indicating the most recently reported Kp-value directly from NOAA SWPC's Estimated Planetary K-index.
How is this gauge different from the old Kp-index bars (R.I.P.) that we had on the old front page you ask? Well, the old Kp-index bars used data from the Wing-Kp index to give both an observed value and a predicted value. As a lot of you know, we have always had a love hate relationship with the Wing-Kp index. While it is very easy to process the data from the Wing-Kp to display on websites and it generates a predicted Kp-value which was an interesting bonus, the Wing-Kp model has its issues. The observed Kp-value from the Wing model often didn't match the value reported by the NOAA SWPC and the predicted Kp-value could sometimes just be ridiculously unreliable. While it's very cool to have a little alert bar screaming the predicted Kp could be 8 in a few minutes (good if you like a lot of traffic but bad for your credibility, try at your own risk) this was often nothing more than the Wing-Kp being a bit too optimistic.
This is why we've been slowly pushing the Wing-Kp index to the background and instead directly use NOAA SWPC's Estimated Planetary K-index. We already used the Estimated Planetary K-index for the Twitter and push alerts since a while back and of course the alert bars in the upper right corner but today is the day the Wing-Kp also disappears from the home page.
Instead, we opt to use this simple gauge indicating the observed Kp-value for the specified time period. During geomagnetic storm conditions, the gauge updates more frequently as the NOAA SWPC issues alerts when a specific storm threshold is reached. The gauge will be green between Kp 0 and 3. Yellow at Kp4 and red for Kp5 or higher. A more accurate, no nonsense, easy to understand feature!
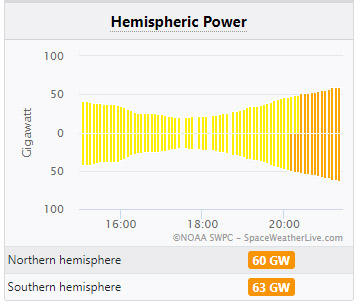
Hemispheric power
Goodie, another new feature! Introducing the Hemispheric Power index! A short explanation stolen from the Hemispheric Power mouse over:
The OVATION model calculates a globally integrated total energy deposition in GigaWatts for up to 30 minutes in the future. For values below about 20GW, there may be little or no aurora observable. For values between 20 and 50, you may need to be near the aurora to see it. For values above 50, the aurora should be quite observable with lots of activity and motion across the sky. Once the Hemispheric Power reaches levels of 100 or more, this is considered to be a very significant geomagnetic storm.
The Hemispheric Power index comes from NOAA's OVATION computer model that we molded into a graph showing the total energy deposition values of the last 6 hours in Gigawatts for both the northern and the southern hemisphere. As you can see below, this graphs give a great, easy to understand overview of the auroral activity of the past few hours, right now and the near future. A very welcome addition we think and easy to understand for new comers!
...anything else?
Oh yes! We added more magnetometers (also accessible with tabs), today's moon phase, a section about coronal holes and much more! Go find it out yourself!
The new front page has also been made even more friendly for mobile phone users. Mobile users would in the old days only see the auroral activity section on the front page and that has changed as well. Thanks to the two tabs you can easily switch on mobile devices between auroral activity and solar activity. No more endless scrolling down. making our website even more useful away from home.
We really hope you will enjoy the new front page. As always with shiny new stuff, there might be things that do not work as intended. If you come across a bug, please report the issue to us and we will send in an expert to professionally eradicate the problem.
Any feedback, ideas and hate/love mail are very much welcome. We love to hear from you. We also like to give a shout out to our translators who we gave a mountain of new sentences to translate! Thank you so much for your fast and excellent work! Enjoy the new front page!
Thank you for reading this article! Did you have any trouble with the technical terms used in this article? Our help section is the place to be where you can find in-depth articles, a FAQ and a list with common abbreviations. Still puzzled? Just post on our forum where we will help you the best we can!
Latest news

X1.1 solar flare with earth-directed CME

Sunspot region 3615, G1 watch
X6.3 solar flare
Latest forum messages
Support SpaceWeatherLive.com!
A lot of people come to SpaceWeatherLive to follow the Sun's activity or if there is aurora to be seen, but with more traffic comes higher server costs. Consider a donation if you enjoy SpaceWeatherLive so we can keep the website online!

Space weather facts
| Last X-flare | 2024/03/28 | X1.1 |
| Last M-flare | 2024/04/19 | M1.0 |
| Last geomagnetic storm | 2024/04/16 | Kp5 (G1) |
| Spotless days | |
|---|---|
| Last spotless day | 2022/06/08 |
| Monthly mean Sunspot Number | |
|---|---|
| March 2024 | 104.9 -19.8 |