Filament erupted, glancing blow possible
Saturday, 5 November 2016 16:53 UTC
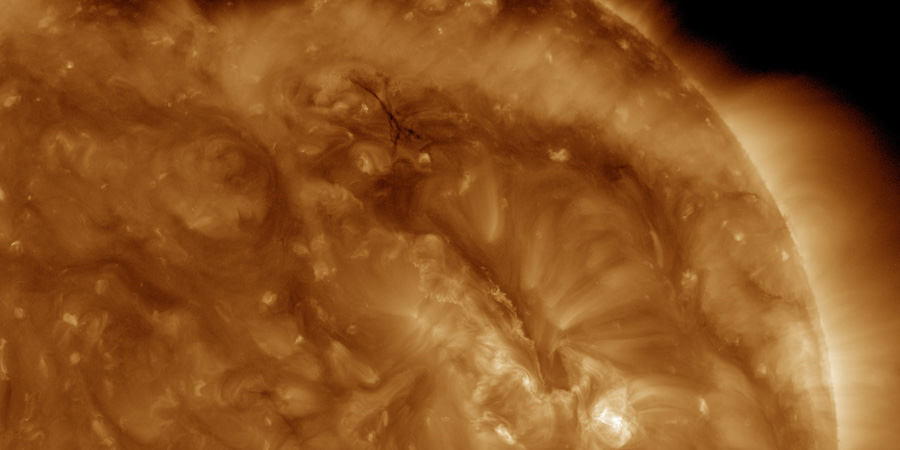
A filament eruption took place this night on the Sun's northern hemisphere.
This timelapse video from NASA's SDO spacecraft shows us how the rope-like structure filled with solar plasma let loose and flew away into space.
As you can see, the filament released mostly towards the north-west meaning we can conclude on the spot that the plasma cloud does not come straight towards Earth. Is there a chance for a glancing blow you ask? Let's take a look at the coronagraph imagery to find out. As we already posted on Facebook this morning, a slow moving coronal mass ejection became quickly visible on the coronagraph imagery from STEREO Ahead and SOHO. The animations below are made with the help of SOHO imagery which images the solar corona from Earth's point of view.
Animation: The CME as seen by SOHO LASCO C2. Click here to see the CME on LASCO C3.
A fairly slow moving partial halo coronal mass ejection became visible with a speed of only 300km/s according to CACtus. These partial halo coronal mass ejections are a real pain to forecast but a halo of 180 degrees can result in a glancing blow at Earth. Geomagnetic storming is unlikely but this could be an event of interest for high latitude sky watchers. A small coronal hole could influence the travel time of this CME but it will likely take this coronal mass ejection a solid four to five days to travel the distance between the Sun and Earth putting a likely arrival time either on 9 or 10 November 2016.
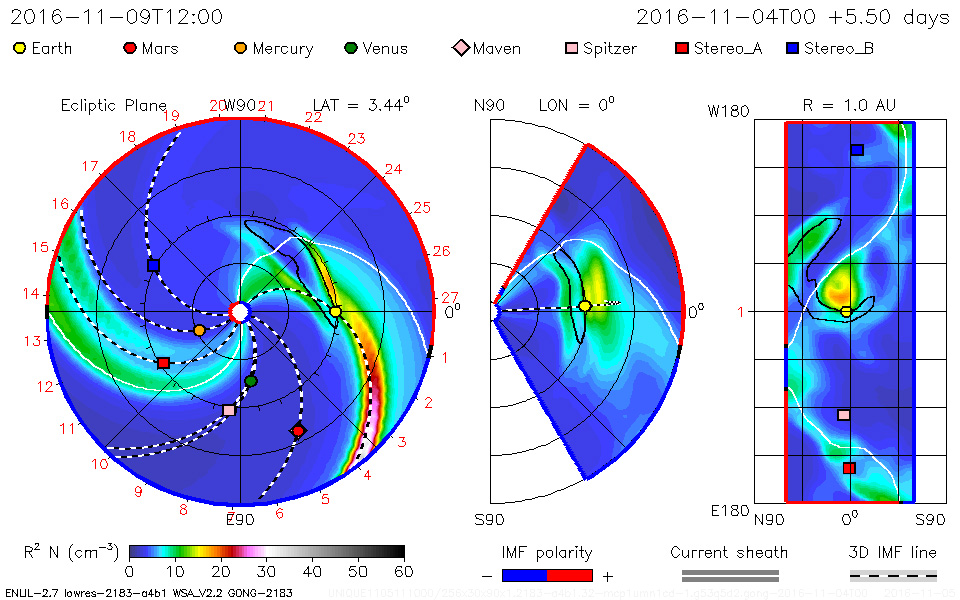
Image: NASA's ENLIL model shows a glancing blow on 9 November.
We admit it is not too much to get excited about but another solar feature we come to know and love is slowly becoming visible: another large coronal hole is about to rotate into Earth's view and that for sure is going to be of interest in the near future. Of course we will post another news item when it faces Earth with more details. Keep an eye on this website!
Thank you for reading this article! Did you have any trouble with the technical terms used in this article? Our help section is the place to be where you can find in-depth articles, a FAQ and a list with common abbreviations. Still puzzled? Just post on our forum where we will help you the best we can!
Latest news

Lot's of sunspots! Big chance for major flare activity?

X1.1 solar flare with earth-directed CME

Sunspot region 3615, G1 watch
Latest forum messages
Support SpaceWeatherLive.com!
A lot of people come to SpaceWeatherLive to follow the Sun's activity or if there is aurora to be seen, but with more traffic comes higher server costs. Consider a donation if you enjoy SpaceWeatherLive so we can keep the website online!

Space weather facts
| Last X-flare | 2024/03/28 | X1.1 |
| Last M-flare | 2024/04/23 | M3.5 |
| Last geomagnetic storm | 2024/04/19 | Kp7 (G3) |
| Spotless days | |
|---|---|
| Last spotless day | 2022/06/08 |
| Monthly mean Sunspot Number | |
|---|---|
| March 2024 | 104.9 -19.8 |
| Last 30 days | 125.4 +21.1 |