Viewing archive of Tuesday, 11 October 2011
Geophysical report
Any mentioned solar flare in this report has a scaling factor applied by the Space Weather Prediction Center (SWPC). Because of the SWPC scaling factor, solar flares are reported as 42% smaller than for the science quality data. The scaling factor has been removed from our archived solar flare data to reflect the true physical units.
Solar and Geophysical Activity Summary 2011 Oct 11 0245 UTCPrepared by the NOAA © SWPC and processed by SpaceWeatherLive.com
Joint USAF/NOAA Solar and Geophysical Activity Summary
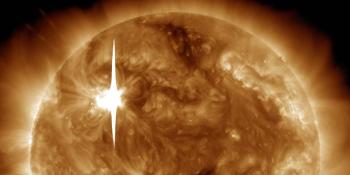
SGAS Number 284 Issued at 0245Z on 11 Oct 2011 This report is compiled from data received at SWO on 10 OctA. Energetic Events
Begin  Max  End  Rgn   Loc   Xray  Op 245MHz 10cm   Sweep
 1123 1123 1123                       170
 1430 1435 1437  1313 S13E03 C4.5  Sf 130
B. Proton Events
None
C. Geomagnetic Activity Summary
Quiet
D. Stratwarm
Not available
E. Daily Indices: (real-time preliminary/estimated values)
10 cm 126  SSN 087  Afr/Ap 002/003   X-ray Background B3.0
Daily Proton Fluence (flux accumulation over 24 hrs)
GT 1 MeV 1.0e+05   GT 10 MeV 1.2e+04 p/(cm2-ster-day)
(GOES-13 satellite synchronous orbit W76 degrees)
Daily Electron Fluence
GT 2 MeV 1.10e+06 e/(cm2-ster-day)
(GOES-13 satellite synchronous orbit W76 degrees)
3 Hour K-indices
Boulder 1 1 1 1 1 2 1 1 Planetary 1 1 0 0 0 1 1 1
F. Comments
None
Latest news

Saturday, 23 March 2024
X1.1 solar flare with earth-directed CME

Wednesday, 20 March 2024
Sunspot region 3615, G1 watch
Thursday, 22 February 2024
X6.3 solar flare
Latest forum messages
Main page of website is down, black/blank circling loading circle for data. 10Growth of Cycle 25 408Imagery from Total Solar Eclipse 08/04/2024 3AR 3637, 3638, 3643 46Interesting four hour class 12
More topicsSupport SpaceWeatherLive.com!
A lot of people come to SpaceWeatherLive to follow the Sun's activity or if there is aurora to be seen, but with more traffic comes higher server costs. Consider a donation if you enjoy SpaceWeatherLive so we can keep the website online!

Space weather facts
| Last X-flare | 2024/03/28 | X1.1 |
| Last M-flare | 2024/04/18 | M1.5 |
| Last geomagnetic storm | 2024/04/16 | Kp5 (G1) |
| Spotless days | |
|---|---|
| Last spotless day | 2022/06/08 |
| Monthly mean Sunspot Number | |
|---|---|
| March 2024 | 104.9 -19.8 |