Viewing archive of Thursday, 20 January 2005
Solar activity report
Any mentioned solar flare in this report has a scaling factor applied by the Space Weather Prediction Center (SWPC). Because of the SWPC scaling factor, solar flares are reported as 42% smaller than for the science quality data. The scaling factor has been removed from our archived solar flare data to reflect the true physical units.
Report of Solar-Geophysical Activity 2005 Jan 20 2200 UTCPrepared by the NOAA © SWPC and processed by SpaceWeatherLive.com
Joint USAF/NOAA Report of Solar and Geophysical Activity
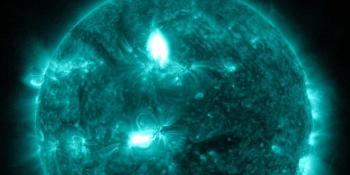
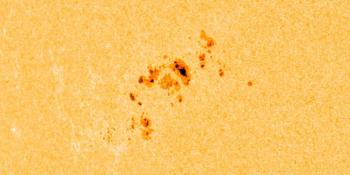
SDF Number 020 Issued at 2200Z on 20 Jan 2005IA. Analysis of Solar Active Regions and Activity from 19-2100Z to 20-2100Z Solar activity was high. Region 720 (N14W70) produced
an X7/2b flare at 0701 UTC, which was accompanied by Type II and
Type IV radio sweeps. There is one image from the LASCO C2
coronagraph which shows an associated CME off the northwest limb at
0654 UTC. However, shortly after this observation the coronagraph
data became difficult to use due to high levels of energetic
particles. Region 720 continues to be large, with a sheared magnetic
delta configuration along an east-west polarity inversion line.
IB. Solar Activity Forecast
Solar activity is expected to be
moderate to high. Region 720 continues to have potential for
producing an additional major flare. The location of Region 720 on
the disk also implies that there is a fair chance for more energetic
particles in association with future major flare activity.
IIA. Geophysical Activity Summary 19-2100Z to 20-2100Z
The geomagnetic field was quiet to active during the past 24 hours.
Solar wind speeds were elevated (700-900 km/s) from the start of the
interval up through at least 0700 UTC, after which the ACE real-time
SWEPAM data became unusable due to elevated energetic particle
flux. The interplanetary magnetic field, however, was weak with
fluctuations between -4 nT to +6 nT. A new injection of protons was
observed at 0650 UTC in association with the X7 flare. The greater
than 100 MeV protons rose rapidly and attained a maximum of 652 PFU
at 0710 UTC. The 100 MeV flux has been declining steadily since
then. This high flux level makes this the largest greater than 100
MeV proton event observed since October 1989. A greater than 10 MeV
proton event was in progress at the time of the new injection, but
the new particles quickly increased the flux from initial values
around 40 PFU to a peak value in the past 24 hours of 1860 PFU at
0810 UTC.
IIB. Geophysical Activity Forecast
The geomagnetic field is
expected to be predominantly unsettled to active for the next three
days. Today's CME (associated with the X7 flare) is not expected to
produce anything more than a glancing blow due to its direction away
from the Sun-Earth line. The greater than 10 MeV flux is expected
to remain above event threshold for at least another 24 hours.
III. Event Probabilities 21 Jan to 23 Jan
| Class M | 90% | 90% | 80% |
| Class X | 30% | 30% | 20% |
| Proton | 99% | 80% | 50% |
| PCAF | in progress | ||
IV. Penticton 10.7 cm Flux
  Observed       20 Jan 123
  Predicted   21 Jan-23 Jan  115/105/095
  90 Day Mean        20 Jan 108
V. Geomagnetic A Indices
  Observed Afr/Ap 19 Jan  031/062
  Estimated     Afr/Ap 20 Jan  012/015
  Predicted    Afr/Ap 21 Jan-23 Jan  015/025-015/020-010/020
VI. Geomagnetic Activity Probabilities 21 Jan to 23 Jan
| A. Middle Latitudes | |||
|---|---|---|---|
| Active | 35% | 35% | 20% |
| Minor storm | 20% | 20% | 15% |
| Major-severe storm | 15% | 15% | 05% |
| B. High Latitudes | |||
|---|---|---|---|
| Active | 35% | 35% | 20% |
| Minor storm | 20% | 20% | 15% |
| Major-severe storm | 15% | 15% | 10% |
Latest news
Latest forum messages
IMF - BT strength 2What are these long and thin eruptions? 3AR 3637, 3638, 3643 89Unproven theories 341Space Weather Memes 338
More topicsSupport SpaceWeatherLive.com!
A lot of people come to SpaceWeatherLive to follow the Sun's activity or if there is aurora to be seen, but with more traffic comes higher server costs. Consider a donation if you enjoy SpaceWeatherLive so we can keep the website online!

Space weather facts
| Last X-flare | 2024/03/28 | X1.1 |
| Last M-flare | 2024/04/25 | M1.3 |
| Last geomagnetic storm | 2024/04/19 | Kp7 (G3) |
| Spotless days | |
|---|---|
| Last spotless day | 2022/06/08 |
| Monthly mean Sunspot Number | |
|---|---|
| March 2024 | 104.9 -19.8 |
| Last 30 days | 133.9 +26.6 |


